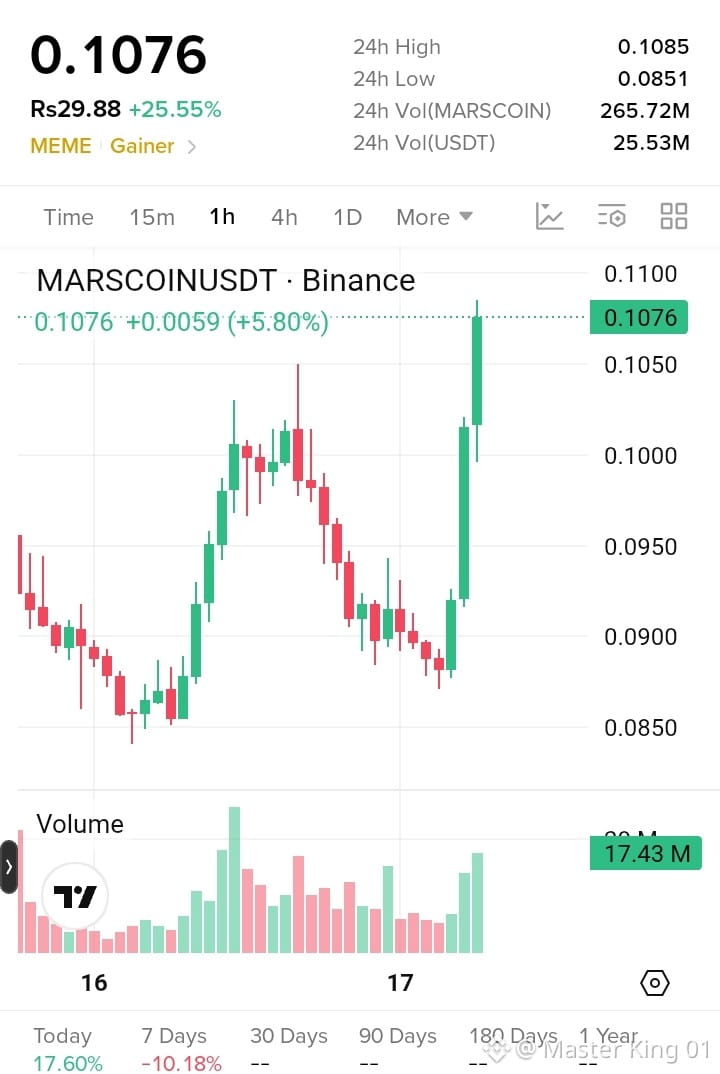
$MARSCOIN USDT on the 1H chart, the structure is different from the previous two: this one is showing a fresh breakout from a rounded/recovery base.
📊 Key levels
Level Significance
0.1085–0.1100 Immediate resistance / 24h high
0.1050 First support after breakout
0.100–0.102 Important breakout-retest zone
0.095 Secondary support
0.090–0.092 Previous consolidation
0.085–0.087 Major recent low
What the chart is showing
Price recovered from about 0.085 → 0.102.
It then pulled back toward 0.087–0.090.
The last two large green candles broke above 0.10 with noticeably increasing volume.
Current price is 0.1076, just below the 0.1085 24h high.
The latest candle has a relatively small upper wick, so buyers are still pushing toward the high.
Two important scenarios
Breakout continuation:
A 1H close above 0.1085–0.1100, followed by holding that area as support, would be a meaningful continuation signal. The next levels would then need to be established from the price action above 0.11.
Rejection:
If 0.1085–0.1100 rejects price, I'd watch 0.105 first and then 0.100–0.102. A return below 0.10 would weaken the immediate breakout structure.
⚠️ The move is already extended, so entering after a large green candle is considerably different from entering on a retest. The 0.100–0.105 region is particularly important for determining whether this breakout holds.
If you send me the next screenshot after another 1H candle closes, I can compare it with this one and tell you whether the breakout is strengthening or starting to fail.
📊 Key levels
Level Significance
0.1085–0.1100 Immediate resistance / 24h high
0.1050 First support after breakout
0.100–0.102 Important breakout-retest zone
0.095 Secondary support
0.090–0.092 Previous consolidation
0.085–0.087 Major recent low
What the chart is showing
Price recovered from about 0.085 → 0.102.
It then pulled back toward 0.087–0.090.
The last two large green candles broke above 0.10 with noticeably increasing volume.
Current price is 0.1076, just below the 0.1085 24h high.
The latest candle has a relatively small upper wick, so buyers are still pushing toward the high.
Two important scenarios
Breakout continuation:
A 1H close above 0.1085–0.1100, followed by holding that area as support, would be a meaningful continuation signal. The next levels would then need to be established from the price action above 0.11.
Rejection:
If 0.1085–0.1100 rejects price, I'd watch 0.105 first and then 0.100–0.102. A return below 0.10 would weaken the immediate breakout structure.
⚠️ The move is already extended, so entering after a large green candle is considerably different from entering on a retest. The 0.100–0.105 region is particularly important for determining whether this breakout holds.
If you send me the next screenshot after another 1H candle closes, I can compare it with this one and tell you whether the breakout is strengthening or starting to fail.