$ARB ARB/INR Market Structure Analysis 📊
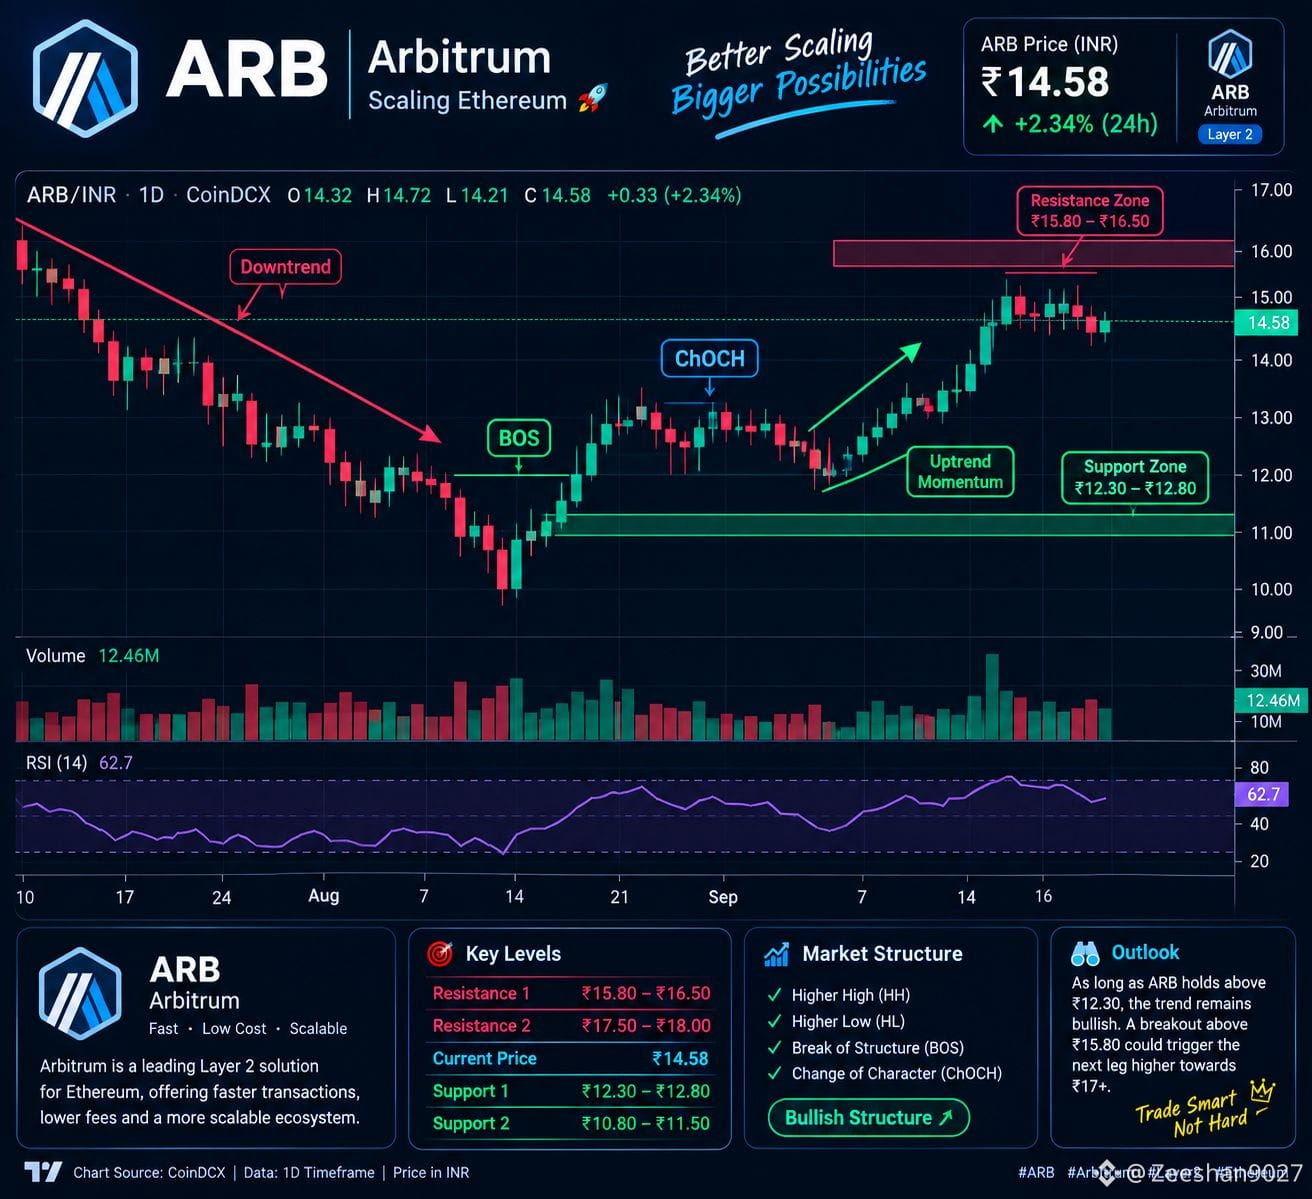
Based on the 1D chart shown, ARB is currently showing a bullish market structure, but price is approaching an important resistance area.
Current Price: ₹14.58
Market Structure: Higher Highs (HH) + Higher Lows (HL)
BOS: Break of Structure confirms a shift toward bullish momentum.
Resistance Zone: ₹15.80–₹16.50
Next Resistance: ₹17.50–₹18.00
Support Zone: ₹12.30–₹12.80
Major Support: ₹10.80–₹11.50
RSI: 62.7 — bullish momentum, but not yet in the traditional overbought zone.
🔎 What the chart suggests
ARB has moved out of its previous downtrend and formed a bullish structure. The recent rally toward ₹15 shows strong buying momentum.
However, ₹15.80–₹16.50 is the key resistance zone. A convincing breakout and hold above this area could indicate further upside toward the next marked resistance around ₹17.50–₹18.00.
On the other hand, rejection near resistance could lead to a pullback toward the ₹12.30–₹12.80 support zone. The chart's bullish structure would become weaker if price starts breaking important higher-low levels.
Overall: The chart currently presents a bullish structure with resistance overhead. Confirmation around the ₹15.80–₹16.50 area is important rather than assuming the breakout will happen.
🚀 Hashtags
#ARB #Arbitrum #ARBINR #Crypto #CryptoMarket #Altcoins #Ethereum #Layer2 #TechnicalAnalysis #MarketStructure #BOS #CHoCH #BullishTrend #CryptoTrading #TradingChart
Based on the 1D chart shown, ARB is currently showing a bullish market structure, but price is approaching an important resistance area.
Current Price: ₹14.58
Market Structure: Higher Highs (HH) + Higher Lows (HL)
BOS: Break of Structure confirms a shift toward bullish momentum.
Resistance Zone: ₹15.80–₹16.50
Next Resistance: ₹17.50–₹18.00
Support Zone: ₹12.30–₹12.80
Major Support: ₹10.80–₹11.50
RSI: 62.7 — bullish momentum, but not yet in the traditional overbought zone.
🔎 What the chart suggests
ARB has moved out of its previous downtrend and formed a bullish structure. The recent rally toward ₹15 shows strong buying momentum.
However, ₹15.80–₹16.50 is the key resistance zone. A convincing breakout and hold above this area could indicate further upside toward the next marked resistance around ₹17.50–₹18.00.
On the other hand, rejection near resistance could lead to a pullback toward the ₹12.30–₹12.80 support zone. The chart's bullish structure would become weaker if price starts breaking important higher-low levels.
Overall: The chart currently presents a bullish structure with resistance overhead. Confirmation around the ₹15.80–₹16.50 area is important rather than assuming the breakout will happen.
🚀 Hashtags
#ARB #Arbitrum #ARBINR #Crypto #CryptoMarket #Altcoins #Ethereum #Layer2 #TechnicalAnalysis #MarketStructure #BOS #CHoCH #BullishTrend #CryptoTrading #TradingChart