


Public blockchains may record every transaction but that does not mean the resulting data provides a clean measure of economic activity, according to a new paper by researchers at the Bank for International Settlements (BIS) and De Nederlandsche Bank (DNB).
The study, Hidden by complexity? Measuring stablecoin, crypto and decentralised finance ecosystems, argues that widely used measures such as
transaction volumes,
market capitalisation, and
total value locked (TVL)
can be heavily distorted by blockchain architecture, user behaviour, and the proliferation of smart contracts.
The researchers analysed 100 billion blockchain records covering Bitcoin, Ethereum, and TRON through the Mercurius data platform which was developed by DNB with the BIS Innovation Hub and Deutsche Bundesbank.
The three networks account for a large share of global cryptoasset and stablecoin activity.
MILESTONE | TRON Surpasses 400 Million Accounts with Low Transaction Fees, Deep USDT Liquidity as Key Drivers
Bitcoin Volumes can Differ 6x
Bitcoin’s UTXO architecture creates one of the biggest measurement problems.
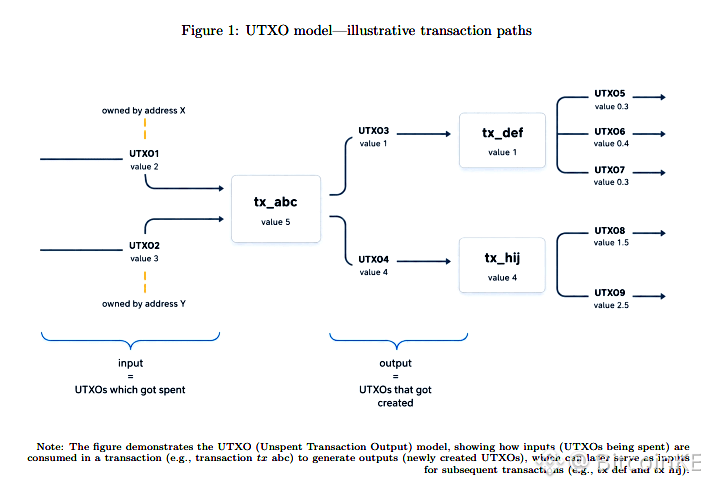
Transactions must spend entire UTXOs, meaning a transaction sending 1.5 BTC from a 4 BTC output can generate a 1.5 BTC payment and 2.5 BTC of change. Blockchain data does not always make that distinction obvious.
As a result, reported Bitcoin transfer values can vary by as much as six times, depending on the methodology used to identify change outputs.
The same problem affects Bitcoin’s market capitalisation.
The researchers estimate that more than 1.8 million BTC had not moved for more than 15 years and use that as a proxy for potentially lost coins. They also compare conventional market capitalisation with realised capitalisation which values coins at the price when they were last moved.
During periods of strong price increases, conventional market capitalisation can reach 4x realised market capitalisation, the paper found.
The underlying Bitcoin dataset covers roughly 1.3 billion transactions and 3.6 billion transaction outputs from 2009 through 2026.
MILESTONE | Bitcoin Has Processed Over 1 Billion Transactions While Settling Over $130 Trillion Since Inception
Ethereum’s Millions of Contracts Create Another Problem
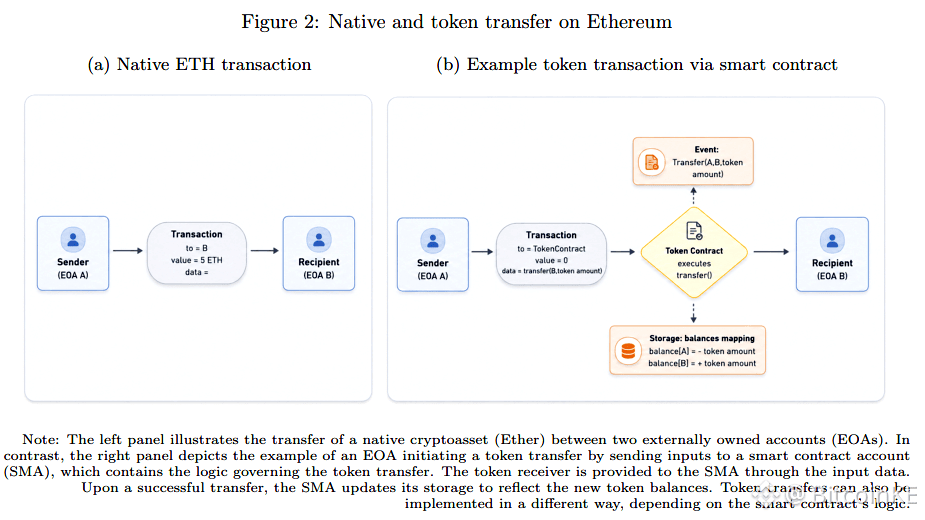
Ethereum presents a different challenge: programmability.
The researchers identify
67.5 million deployed and active contracts, of which
more than 54 million were not technically classified.
About 11.8 million were proxy contracts, while
1.4 million were ERC-20 fungible-token contracts and
roughly 100,000 were ERC-721 NFT contracts.
The sheer number of contracts does not translate directly into economic activity.
The study found widespread token-name duplication, including approximately 6,867 ERC-20 contracts using the USDT symbol. Such duplication can inflate estimates of the number of economically meaningful tokens and create noise for analysts attempting to identify legitimate assets.
The problem extends beyond names. A smart contract can generate multiple transactions, logs and internal calls from a single user action, meaning simply counting blockchain records can substantially overstate the amount of underlying economic activity.
Stablecoins Expose the Biggest Cross-Chain Problem
Stablecoins provide perhaps the clearest example of why blockchain data cannot always be aggregated without context.
The researchers’ dataset covers about 82% of the stablecoin market, with near-complete coverage of USDT. At the time of the study, USDT supply was roughly $180 billion, while USDC stood at about $75 billion and Sky Dollar (USDS) at around $8 billion.
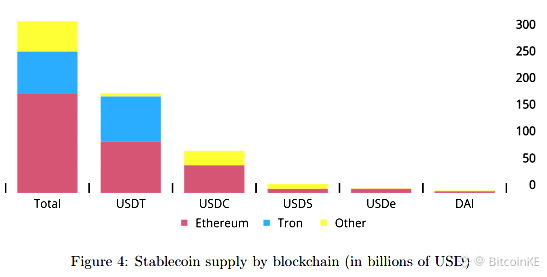
But the same stablecoin can perform very different functions depending on the blockchain.
On Ethereum, more than 20% of USDT holdings have been held in smart contracts indicating stronger links to DeFi activities such as liquidity provision and collateralisation.
On TRON, the comparable share has generally remained around 1%. The researchers say the pattern points to greater transactional and store-of-value use for USDT on TRON, while Ethereum USDT is more deeply integrated into DeFi.
That distinction matters because adding USDT activity across both chains into one headline number can make fundamentally different economic activities look identical.
MILESTONE | TRON Dominates Issuance, Settlement of World’s Largest Stablecoin in H1 2026
Fake USDT Activity Reached Huge Levels
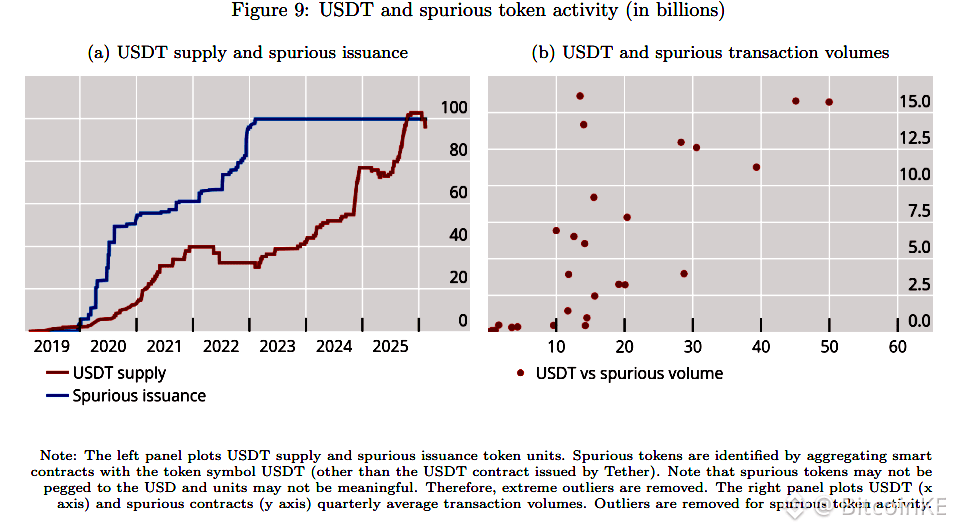
The study also highlights the scale of spurious token activity.
Researchers identified Ethereum contracts using the USDT symbol other than the genuine Tether contract. By the end of their sample, cumulative issuance of these potentially spurious tokens had reached roughly 100 billion units.
Associated transaction activity reached more than 15 billion in some periods despite the tokens generally having no relationship to Tether’s actual USDT reserves.
The researchers caution that symbol re-use alone does not prove fraud but say some of the activity likely relates to scams and that token names are an unreliable basis for determining economically relevant assets.
Stablecoin Growth Does Not Automatically Mean More DeFi
The paper also finds that rising stablecoin issuance does not necessarily translate into greater DeFi usage.
Stablecoin issuance increased sharply around the 2024 U.S. election and again following passage of the U.S. GENIUS Act, but the increase was not accompanied by a sustained rise in stablecoins held by smart contracts.
Since late 2024, the share of USDT held in Ethereum smart contracts has declined to roughly 10%-15%, according to the study.
That suggests analysts should distinguish between stablecoin supply growth and actual DeFi utilisation rather than treating the two as interchangeable measures.
2024 MILESTONE | Stablecoins Locked on Ethereum Layer 2 Networks Surpass $13 Billion in 2024, USDT Dominates
The BIS study identifies three structural problems:
Bitcoin’s aggregation problem,
Ethereum’s programmability problem, and
the cross-chain comparability problem.
Its conclusion is straightforward:
On-chain indicators should be treated as noisy approximations rather than direct measures of economic activity.
Researchers recommend
bounded estimates,
transparent assumptions,
technical classification, and
greater disaggregation
instead of relying on single headline figures.
For regulators and investors, the implication is significant.
A blockchain can tell you exactly what happened on-chain without necessarily telling you why it happened, who economically controlled the assets, or what economic activity the transaction represents.
That distinction is becoming increasingly important as stablecoins and DeFi become more connected to traditional finance.
Over 50% of All Bitcoin Trading Volume on Crypto Exchanges is Fake, Says Latest 2022 Forbes Report
Stay tuned to BitKE on crypto developments globally.
Join our WhatsApp channel here.
Follow us on X for the latest posts and updates
Join and interact with our Telegram community
_________