
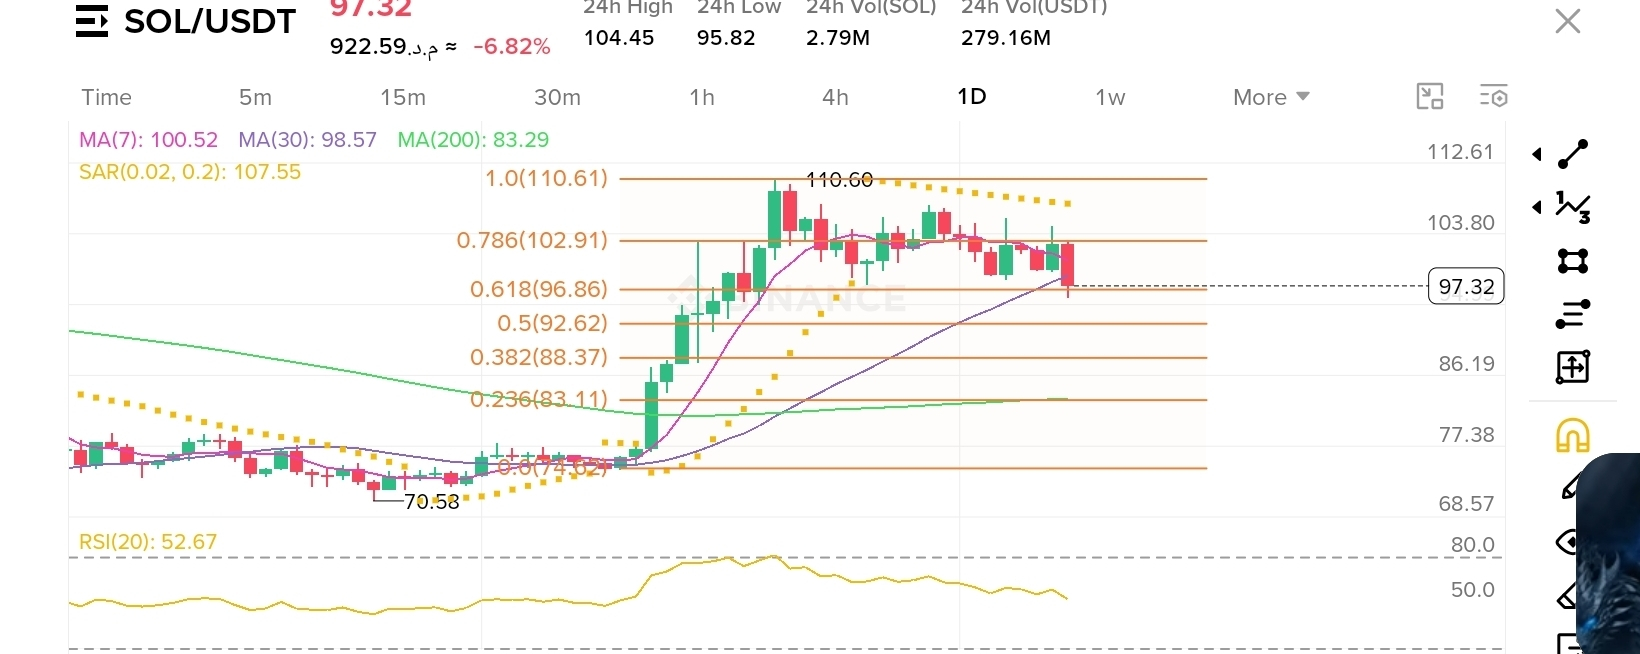
$SOL is trading around 97.32 USDT, down 6.82%, after failing to hold the 102.91 USDT Fibonacci resistance zone.
The chart shows a strong rally from approximately 70.53 to 110.61, followed by a period of consolidation. However, momentum has recently weakened:
- Price is below the 7-day MA at 100.52, indicating short-term weakness.
- Price is also slightly below the 30-day MA at 98.57, making this an important level to reclaim.
- The Parabolic SAR at 107.55 remains above price, suggesting the daily trend is still bearish.
- RSI is at 52.67—neutral, but declining from higher levels. This indicates that momentum has cooled without reaching oversold conditions.
- The 96.86 USDT Fibonacci 0.618 level is the immediate support area currently being tested.
### Key levels to watch
Bullish scenario:
A daily close back above 98.57–100.52 could improve momentum and open the way toward 102.91. A sustained move above 102.91 would be needed to target the 107.55–110.61 region.
Bearish scenario:
If SOL decisively loses 96.86, the next support zones are around 92.62, 88.37, and then 83.11–83.29, where the 200-day moving average is positioned.
### Conclusion
The broader structure remains constructive while SOL holds above the 200-day MA, but the short-term chart is under pressure. For now, 96.86 is the key line between a potential rebound and a deeper pullback. Traders should wait for confirmation rather than treating the current level as a guaranteed reversal.
This is technical analysis for educational purposes only and not financial advice.