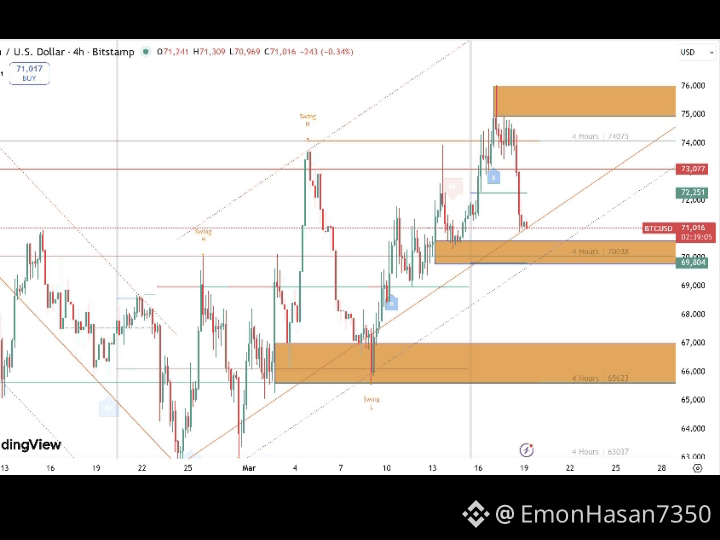
#BitcoinSlidesTo$76000
Based on the latest market data, BTC is around the $77,000 area and has recently been under pressure. Bitcoin is also facing unusually high volatility because of the September 16 Federal Reserve decision, while recent trading has shown support around the mid-$76K area. �
TradingView +1
BTC — Next 10 Hours Scenario
My short-term view: ⚠️ Neutral to slightly bearish
Current area: ~$77,000
Main support: $76,500
Strong support: $75,500
First resistance: $78,500
Major resistance: $79,500
Most likely scenario: BTC may continue moving sideways between roughly $76,500–$78,500 before a stronger move.
Bullish scenario: If BTC breaks and holds above $78,500, it could potentially move toward $79,500.
Bearish scenario: If BTC loses $76,500, the next potential target is around $75,500.
The chart below shows the possible
Based on the latest market data, BTC is around the $77,000 area and has recently been under pressure. Bitcoin is also facing unusually high volatility because of the September 16 Federal Reserve decision, while recent trading has shown support around the mid-$76K area. �
TradingView +1
BTC — Next 10 Hours Scenario
My short-term view: ⚠️ Neutral to slightly bearish
Current area: ~$77,000
Main support: $76,500
Strong support: $75,500
First resistance: $78,500
Major resistance: $79,500
Most likely scenario: BTC may continue moving sideways between roughly $76,500–$78,500 before a stronger move.
Bullish scenario: If BTC breaks and holds above $78,500, it could potentially move toward $79,500.
Bearish scenario: If BTC loses $76,500, the next potential target is around $75,500.
The chart below shows the possible