#usdjpy "This is not financial advice. Trade at your own risk."
/JPY 30-Minute Chart Analysis
* Currency Pair: USD/JPY (U.S. Dollar / Japanese Yen)
* Timeframe: 30-Minute Chart (30m)
* Market Outlook: Bearish (Short Trade Setup)
Key Technical Levels
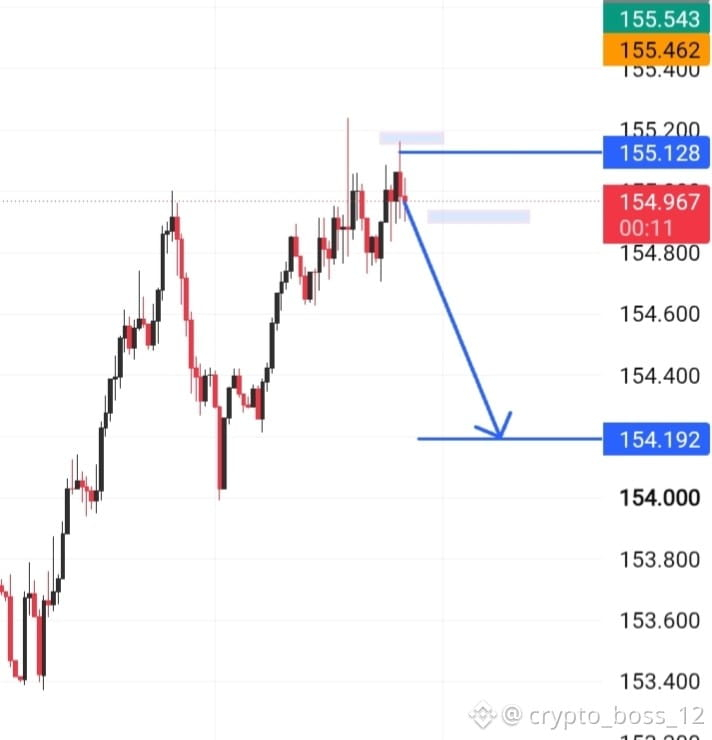
* Resistance / Invalidation Level: 155.128 (Highlighted blue line near the recent local peak/supply zone)
* Current Market Price: 154.967
* Target Price (Take Profit): 154.192 (Marked by the blue horizontal line and downward blue arrow)
Analysis Breakdown
* Supply Zone Rejection: The price rallied to test the resistance zone around 155.128, where it hit resistance and began reversing downward, indicating exhaustion among buyers.
* Bearish Projection: The blue arrow projects a sharp downward movement from the current price area (154.967) toward the primary support level at 154.192.
* Trade Strategy: A short position (sell trade) targeting the lower support area at 154.192, with a stop-loss positioned above the local high at 155.128 for a high risk-to-reward ratio.
/JPY 30-Minute Chart Analysis
* Currency Pair: USD/JPY (U.S. Dollar / Japanese Yen)
* Timeframe: 30-Minute Chart (30m)
* Market Outlook: Bearish (Short Trade Setup)
Key Technical Levels
* Resistance / Invalidation Level: 155.128 (Highlighted blue line near the recent local peak/supply zone)
* Current Market Price: 154.967
* Target Price (Take Profit): 154.192 (Marked by the blue horizontal line and downward blue arrow)
Analysis Breakdown
* Supply Zone Rejection: The price rallied to test the resistance zone around 155.128, where it hit resistance and began reversing downward, indicating exhaustion among buyers.
* Bearish Projection: The blue arrow projects a sharp downward movement from the current price area (154.967) toward the primary support level at 154.192.
* Trade Strategy: A short position (sell trade) targeting the lower support area at 154.192, with a stop-loss positioned above the local high at 155.128 for a high risk-to-reward ratio.