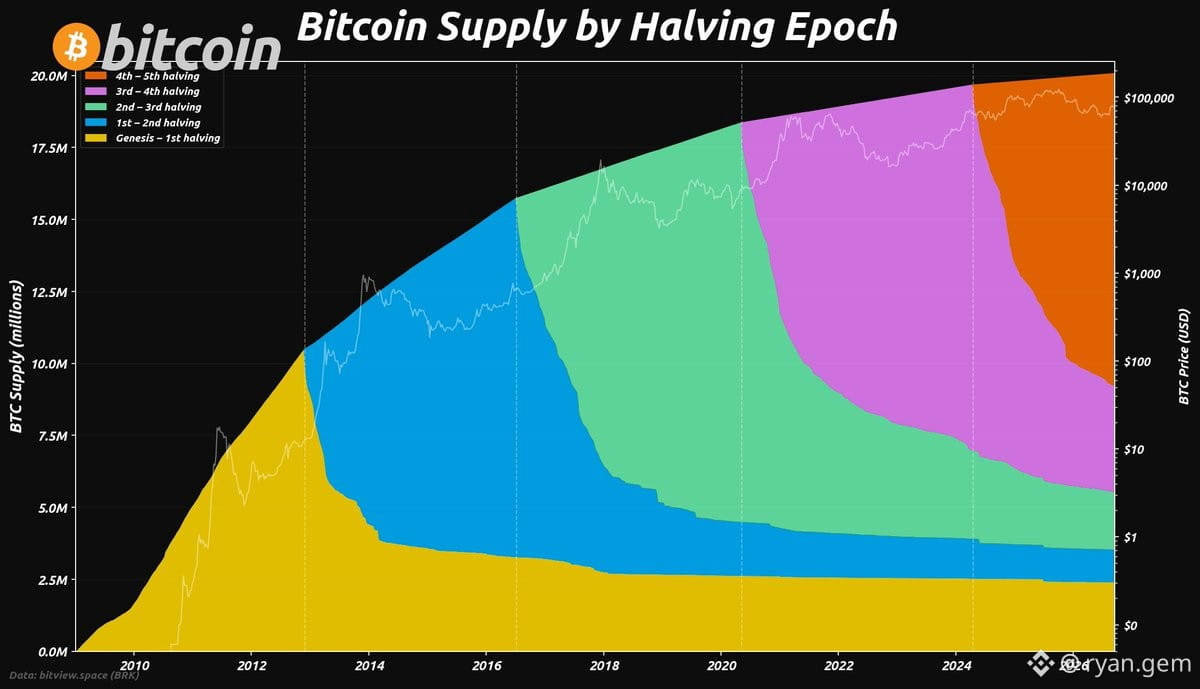
$BTC supply distribution by halving epoch is wild when you stack it:
Epoch 0: 2.40M
Epoch 1: 1.13M
Epoch 2: 2.01M
Epoch 3: 3.69M
Epoch 4: 10.86M
Notice how Epoch 4 holds over half the circulating supply. These are the coins that came in during peak retail mania and institutional onboarding. Most of this supply has seen massive drawdowns and capitulation events.
Earlier epoch coins? Diamond hands. They've survived multiple cycles and are statistically less likely to move. This distribution tells you where the weak hands sit and where the conviction lies.
Supply dynamics matter. Liquidity crises don't come from old coins moving—they come from Epoch 3-4 panic selling into thin order books.
Epoch 0: 2.40M
Epoch 1: 1.13M
Epoch 2: 2.01M
Epoch 3: 3.69M
Epoch 4: 10.86M
Notice how Epoch 4 holds over half the circulating supply. These are the coins that came in during peak retail mania and institutional onboarding. Most of this supply has seen massive drawdowns and capitulation events.
Earlier epoch coins? Diamond hands. They've survived multiple cycles and are statistically less likely to move. This distribution tells you where the weak hands sit and where the conviction lies.
Supply dynamics matter. Liquidity crises don't come from old coins moving—they come from Epoch 3-4 panic selling into thin order books.