Three charts just printed the same shape within hours of each other — and that's not something you see every day.
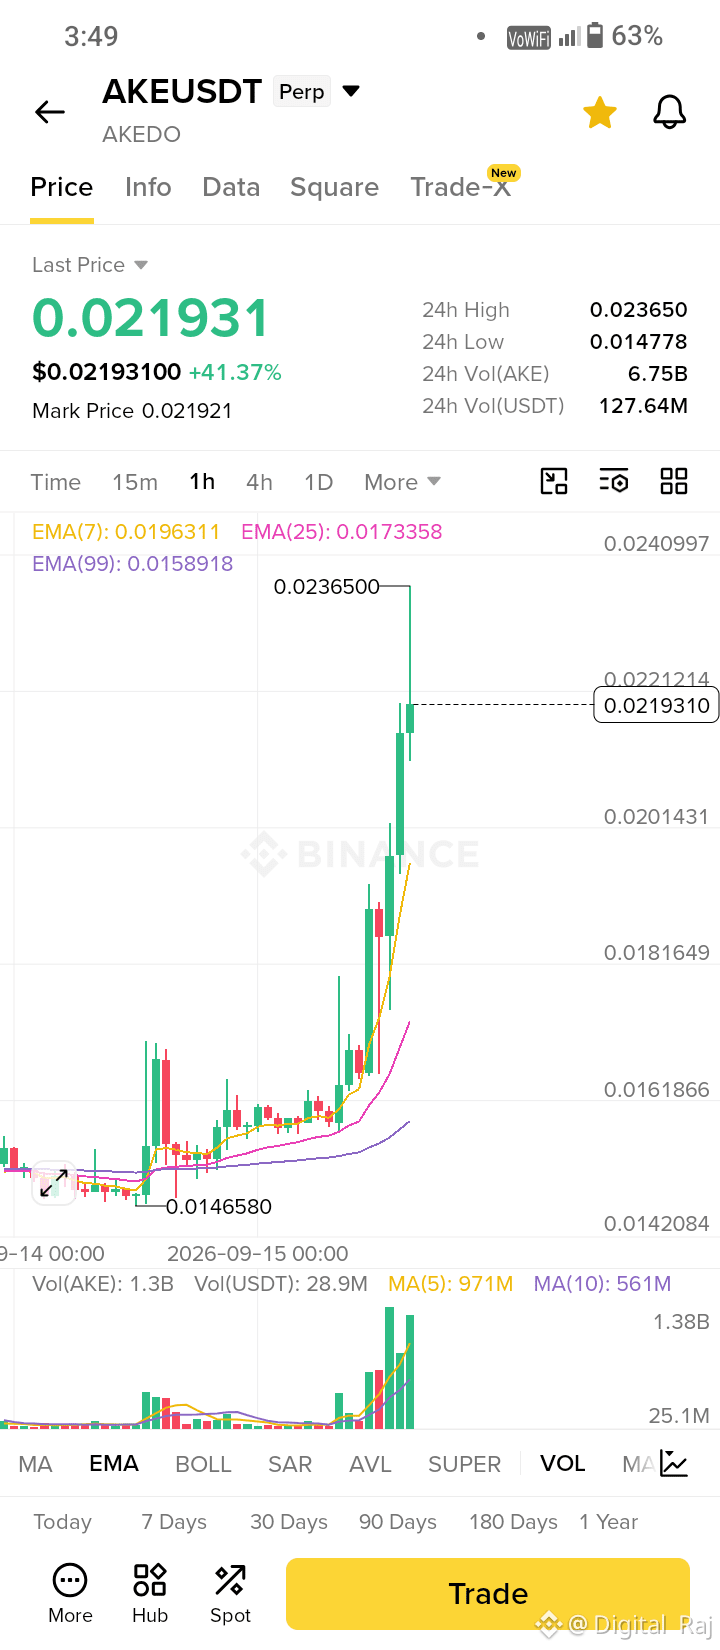
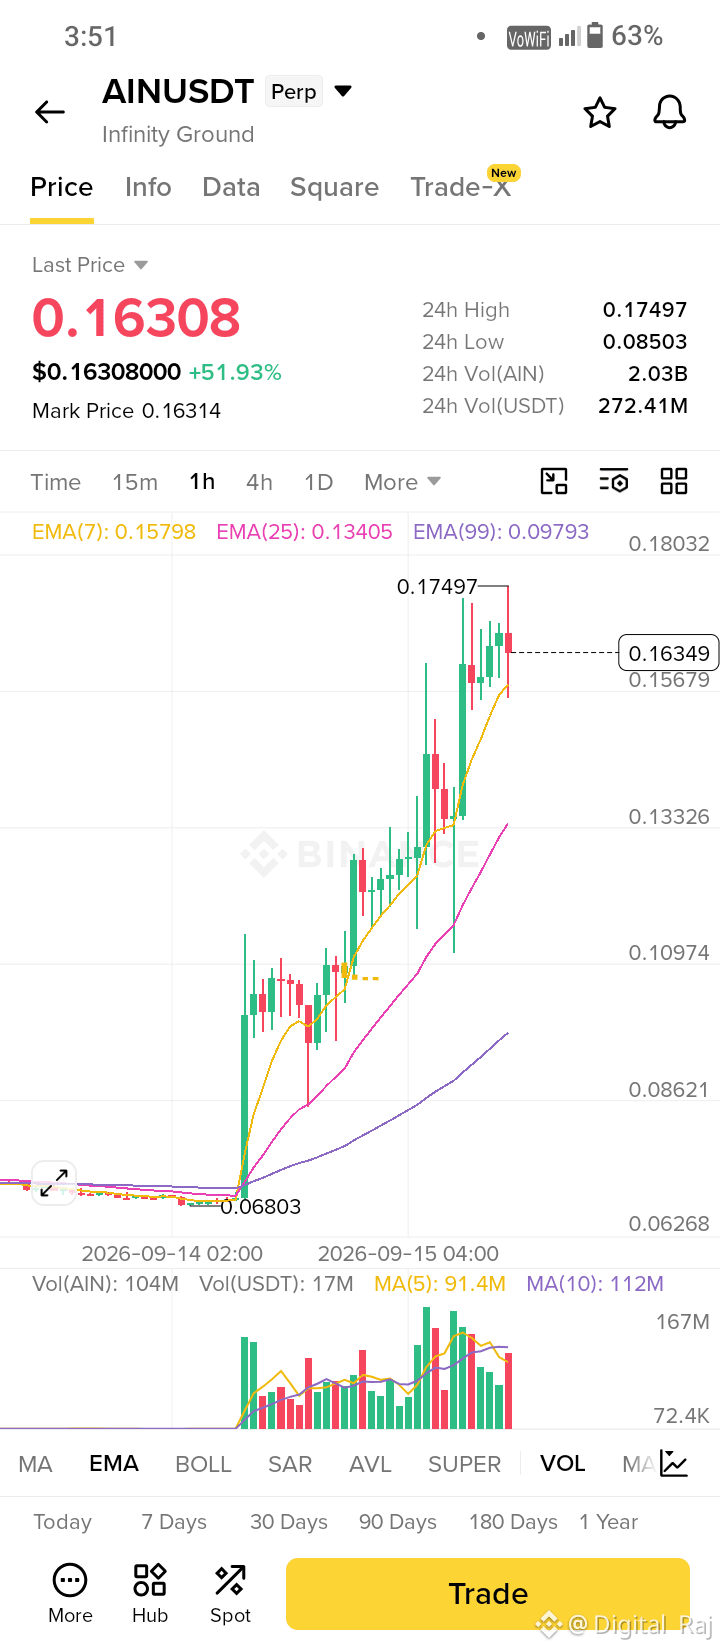
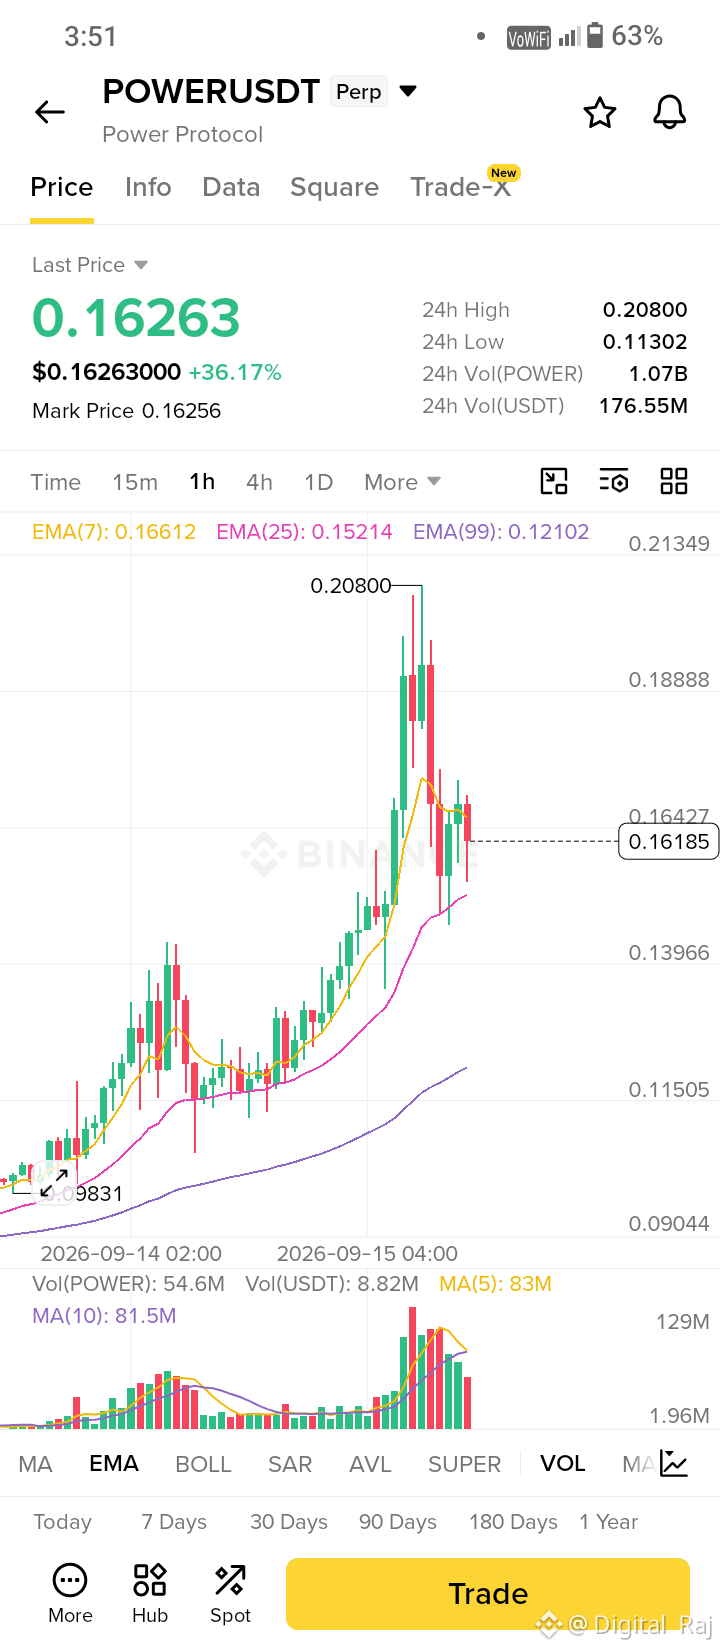
$AKE ripped +41%, from 0.0146 to a high of 0.0236. $AIN followed with +52%, tearing from 0.068 to 0.175. $POWER matched the move almost candle-for-candle, up +36% from 0.098 to 0.208.
Different tickers, different starting prices — but stack the charts side by side and the acceleration point lines up almost perfectly. That's not three coincidences. That's one wave of capital moving through the same lane, hitting each target back to back.
All three are now pulling back from their highs, sitting right on their EMA(7) — the exact zone that decides if this was a warm-up or the top. Coins don't usually sync up like this by accident, and when they do, the next move tends to happen just as fast as the first one did.
Watch which one holds its EMA(7) first. That's usually where the next leg starts. 👀
$AKE ripped +41%, from 0.0146 to a high of 0.0236. $AIN followed with +52%, tearing from 0.068 to 0.175. $POWER matched the move almost candle-for-candle, up +36% from 0.098 to 0.208.
Different tickers, different starting prices — but stack the charts side by side and the acceleration point lines up almost perfectly. That's not three coincidences. That's one wave of capital moving through the same lane, hitting each target back to back.
All three are now pulling back from their highs, sitting right on their EMA(7) — the exact zone that decides if this was a warm-up or the top. Coins don't usually sync up like this by accident, and when they do, the next move tends to happen just as fast as the first one did.
Watch which one holds its EMA(7) first. That's usually where the next leg starts. 👀