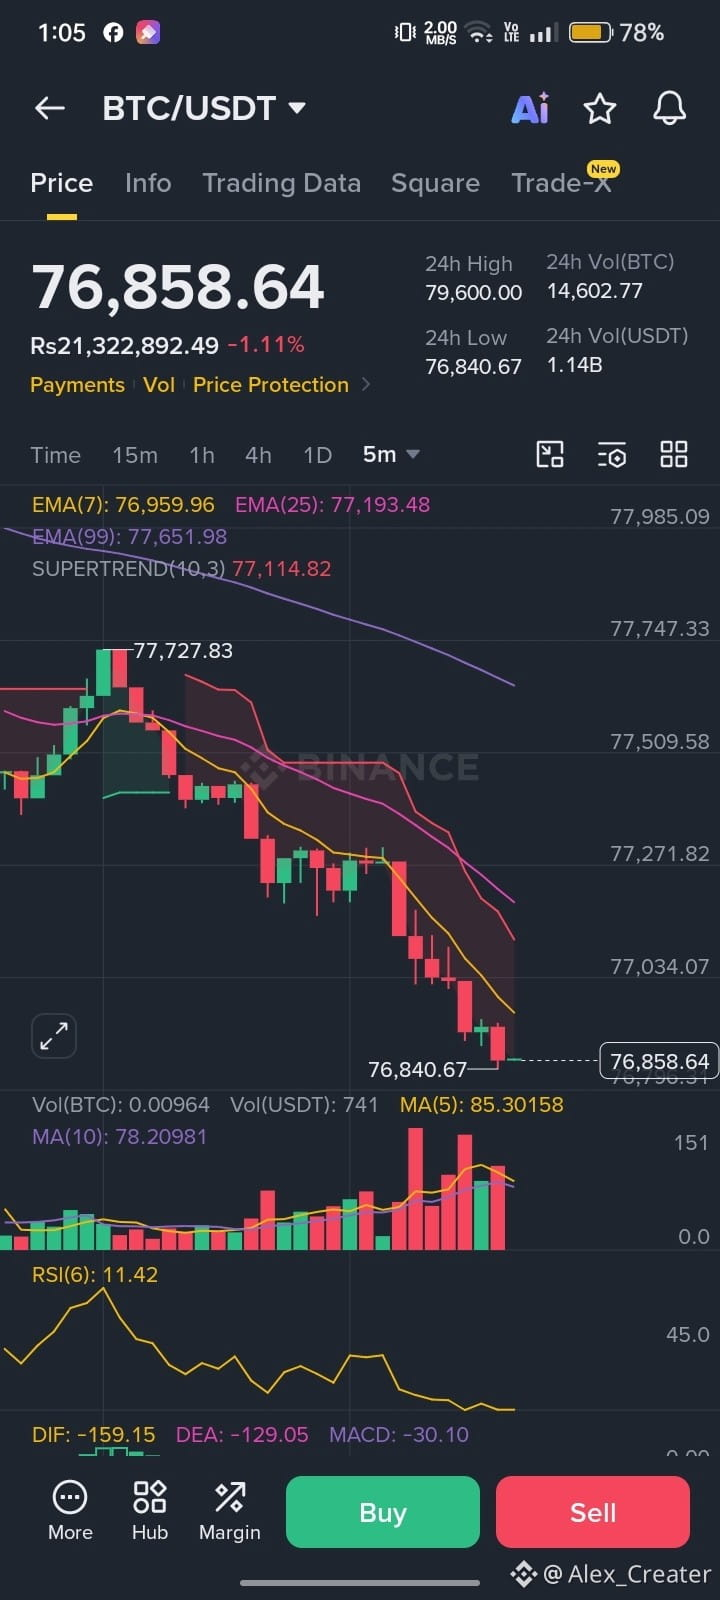
$BTC/USDT — 5-Minute Chart Analysis
Based on your screenshot, short-term trend is strongly bearish, but the market is also extremely oversold, so a temporary bounce is possible.
Current price: 76,858
24h change: -1.11%
🔴 Trend
Price is below EMA 7: 76,959
Below EMA 25: 77,193
Below EMA 99: 77,652
Supertrend is bearish around 77,115
➡️ All major moving averages are above price, confirming selling pressure.
📉 Momentum
RSI: 11.42 → Extremely oversold
MACD: -30.10 → Bearish momentum
Selling volume has increased → sellers currently dominate.
Important Levels
Support:
76,840 — immediate support / current low
If this breaks decisively: possible move toward 76,700–76,500
Resistance:
76,960 — first resistance (EMA 7)
77,115–77,195 — strong resistance zone
Above 77,200, bearish pressure may weaken.
Based on your screenshot, short-term trend is strongly bearish, but the market is also extremely oversold, so a temporary bounce is possible.
Current price: 76,858
24h change: -1.11%
🔴 Trend
Price is below EMA 7: 76,959
Below EMA 25: 77,193
Below EMA 99: 77,652
Supertrend is bearish around 77,115
➡️ All major moving averages are above price, confirming selling pressure.
📉 Momentum
RSI: 11.42 → Extremely oversold
MACD: -30.10 → Bearish momentum
Selling volume has increased → sellers currently dominate.
Important Levels
Support:
76,840 — immediate support / current low
If this breaks decisively: possible move toward 76,700–76,500
Resistance:
76,960 — first resistance (EMA 7)
77,115–77,195 — strong resistance zone
Above 77,200, bearish pressure may weaken.