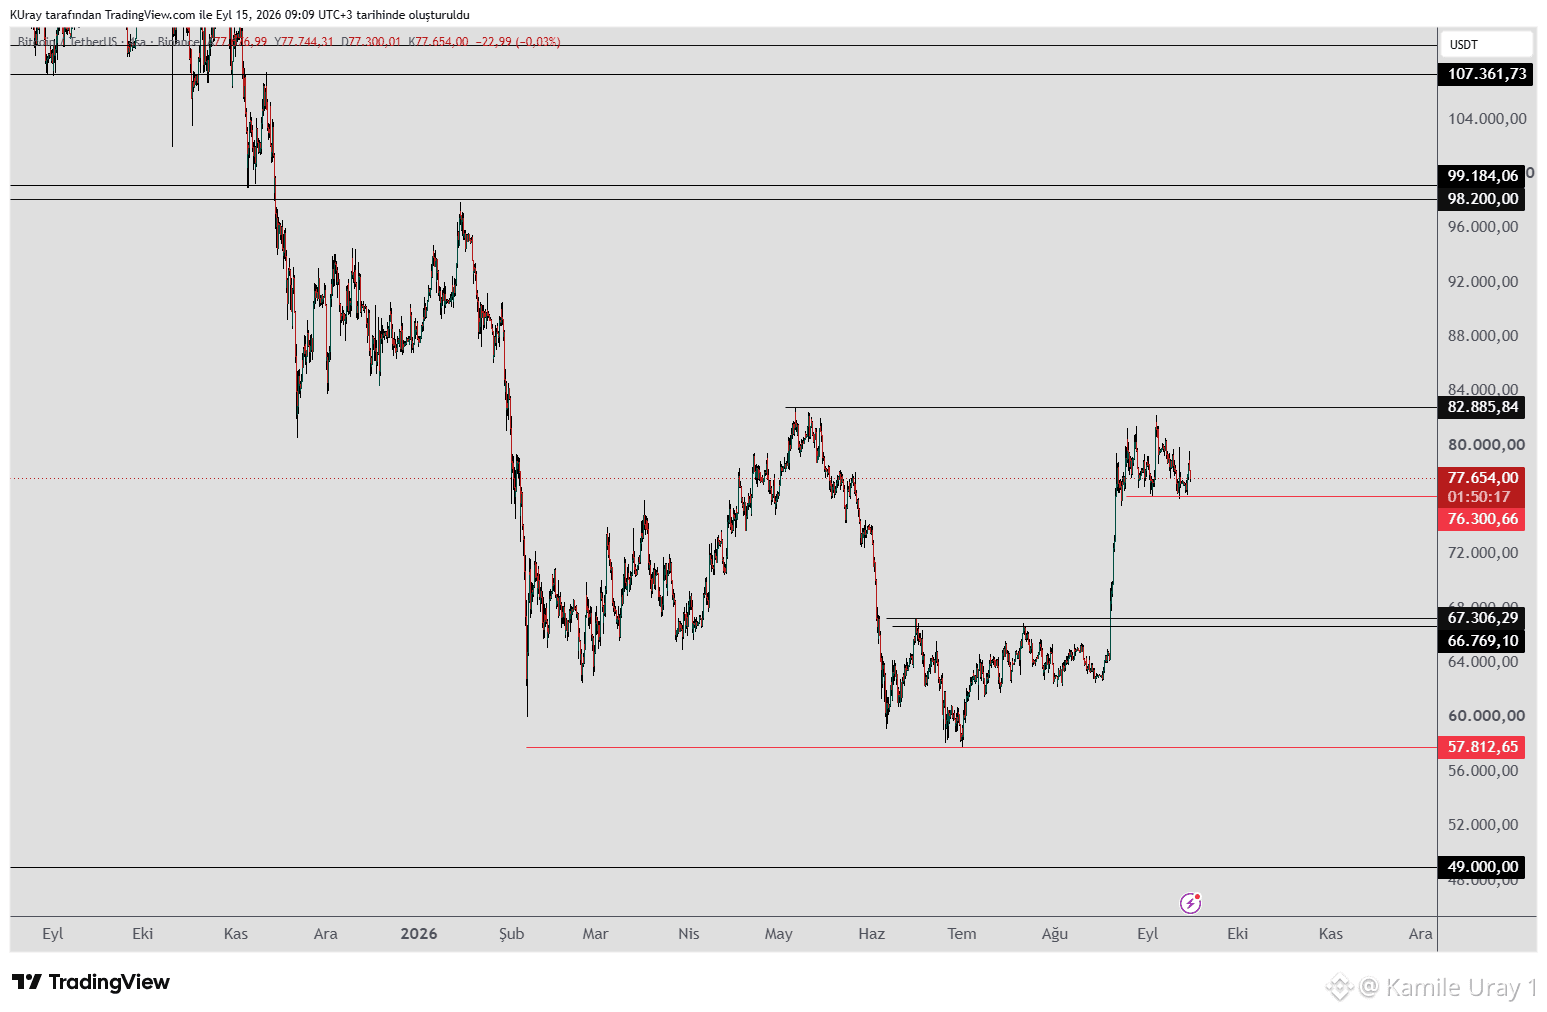
#BTC appears set to trade within the same range until the Fed interest rate decision on the 16th.
Sharp price swings—in either direction—are likely on the day of the decision. We are keeping a close watch on the 76,300 level; regardless of volatility, 4-hour candle closes remain the key indicator for us.
As long as the price holds above 76,300 on the 4-hour chart, the potential for an upward move remains intact.
If the price closes below 76,300, there is a possibility of testing the support zone around 67,000–66,000. Such a decline could form the final shoulder of a potential inverse head-and-shoulders (H&S) pattern. If the price subsequently holds above 83,000, the pattern would be activated, and a continued rise toward upper resistance levels would be expected.
If a daily or weekly close occurs above 82,885, it would mark the first higher high relative to the most recent downward wave. This would provide further confirmation that the upward trend is likely to continue, allowing us to monitor the upper resistance levels thereafter.
Sharp price swings—in either direction—are likely on the day of the decision. We are keeping a close watch on the 76,300 level; regardless of volatility, 4-hour candle closes remain the key indicator for us.
As long as the price holds above 76,300 on the 4-hour chart, the potential for an upward move remains intact.
If the price closes below 76,300, there is a possibility of testing the support zone around 67,000–66,000. Such a decline could form the final shoulder of a potential inverse head-and-shoulders (H&S) pattern. If the price subsequently holds above 83,000, the pattern would be activated, and a continued rise toward upper resistance levels would be expected.
If a daily or weekly close occurs above 82,885, it would mark the first higher high relative to the most recent downward wave. This would provide further confirmation that the upward trend is likely to continue, allowing us to monitor the upper resistance levels thereafter.