



Binance wallet movements added substantial LINK supply, while price still held above $11.50 during the latest consolidation phase.
LINK climbed from $10.92 to $13.64 before retreating, showing buyers absorbed heavy exchange-related supply during that period.
BBW dropped sharply from 71.24 to 10.91, while negative MACD momentum points toward a quieter market phase.
LINK market outlook shows supply pressure meeting fading volatility, while price consolidates after a sharp rally and momentum indicators turn weaker.
Binance Transfers Put Supply Into Focus
Nazoku reported that Binance opened cold storage and moved 10 million LINK. TThe transfer was valued at about $116.6 million on August 27. Another 2 million LINK later was released which cost a little under $23.08 million.
https://twitter.com/Nazo_ku/status/2098622507137855537?s=20
Together, those movements brought reported weekly supply near $140 million. That amount represented roughly half of Binance’s reported 24-hour volume. It also exceeded 30% of combined DEX and CEX volume.
The wallet panel shows transfers between Binance cold and hot wallets. Several transactions involve 1 million LINK or more within the displayed period. However, wallet transfers alone do not confirm that tokens were sold.
Instead, they show substantial LINK being repositioned within exchange-controlled wallets. Cold-to-hot movements can increase readily available liquidity for potential trading activity. Therefore, subsequent price behavior remains important when assessing the supply effect.
Price Holds After a Sharp Intraday Move
LINK previously climbed from $10.92-$13.64 between September 2 and September 7. That advance followed the initial Binance transfer and a brief market correction. The recovery showed continued buying despite substantial exchange-related token movements.
 Source: Coinmarketcap
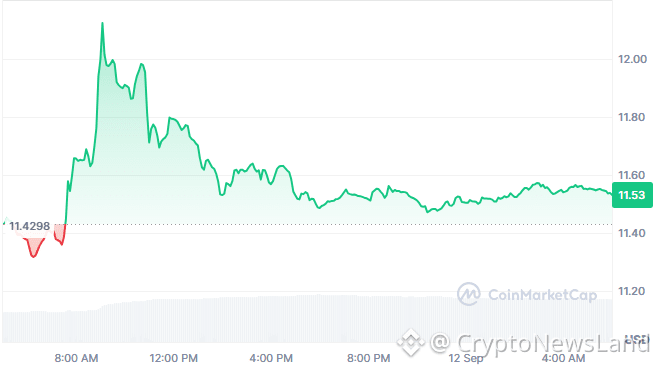
The latest chart shows a price near $11.55 after another volatile session. Price initially dropped toward the $11.30 area before reversing sharply higher. The recovery then pushed above $12 before sellers returned to the market.
After reaching above $12, price gradually formed lower highs through the session. It eventually moved toward $11.60 before entering a narrower trading range.The evening and overnight action remained mostly between $11.50 and $11.60.
The $11.50 region now provides an important short-term reference for price. Holding that area would preserve the recent consolidation structure visible on the chart. A sustained break lower would place earlier session levels back into focus.
Volatility Contracts as Momentum Weakens
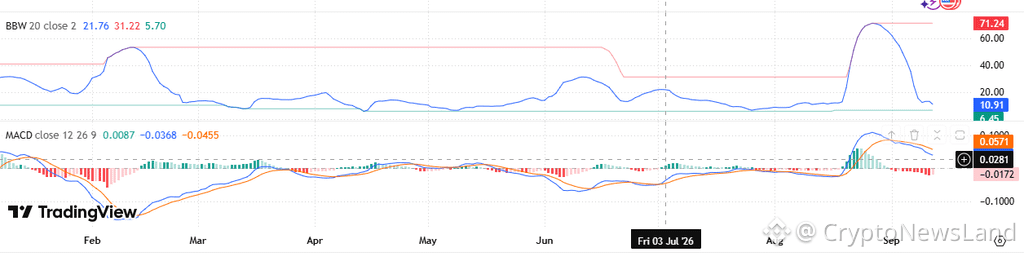
The technical chart shows Bollinger Band Width reaching approximately 71.24 in late August. Before that expansion, BBW remained mostly below 20 for several months. The sudden increase marked a major shift from prolonged price compression.
 Source: Tradingview
Since then, BBW has fallen sharply toward approximately 10.91. That contraction indicates that the earlier volatility surge has largely subsided. Price is consequently entering a much quieter phase than the breakout period.
The MACD also shows a clear change from the earlier bullish momentum. The indicator surged during the late-August advance before turning lower afterward. Its histogram has moved negative, reaching approximately -0.0171 on the displayed chart.
The current structure combines supply concerns with contracting volatility and weaker momentum. Meanwhile, LINK remains above the session’s early low near $11.30. The LINK market outlook therefore centers on whether buyers can defend consolidation support.