


Bitcoin is trading around $79,059, up roughly 2.19%, but there’s an important detail beneath the green candle that traders shouldn’t ignore.
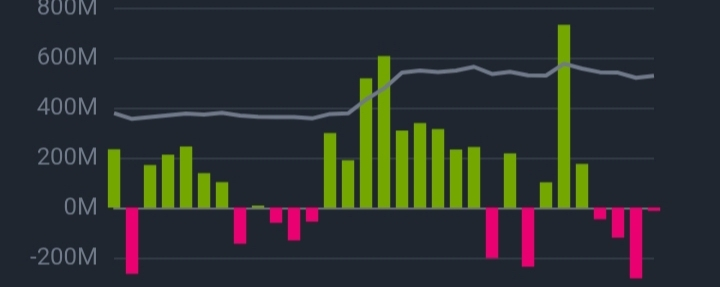
The latest ETF data shown in the chart points to mixed institutional demand. On September 11, spot Bitcoin ETFs recorded a $13.2M net outflow, while total ETF net assets remained around $147.5B.
That creates an interesting market structure.
Over the past several weeks, ETF flows have repeatedly switched between strong inflows and meaningful outflows. The chart shows several sessions with hundreds of millions of dollars entering, followed by sharp withdrawals.
So what does this actually mean?
It doesn’t automatically signal that institutions are bearish.
Instead, it suggests that institutional positioning is becoming more selective. Capital is still sitting inside the Bitcoin ETF ecosystem, but fresh money is not entering consistently every day.
That distinction matters.
Bitcoin can continue rising even when daily ETF flows are negative because price is influenced by multiple forces: spot demand, derivatives positioning, liquidity, short covering and existing holders reducing selling pressure.
For me, the key level is still around the high-$70K area.
If BTC can hold this zone while ETF flows stabilize and return to sustained inflows, the current recovery could gain stronger confirmation.
But if price rises while outflows repeatedly accelerate, traders should be careful about treating every green candle as genuine accumulation.
The real question isn’t simply “Is BTC going up?”
It’s: who is providing the demand behind the move? 📊
