🚀 AI IS BREAKING OUT OF A LONG CONSOLIDATION
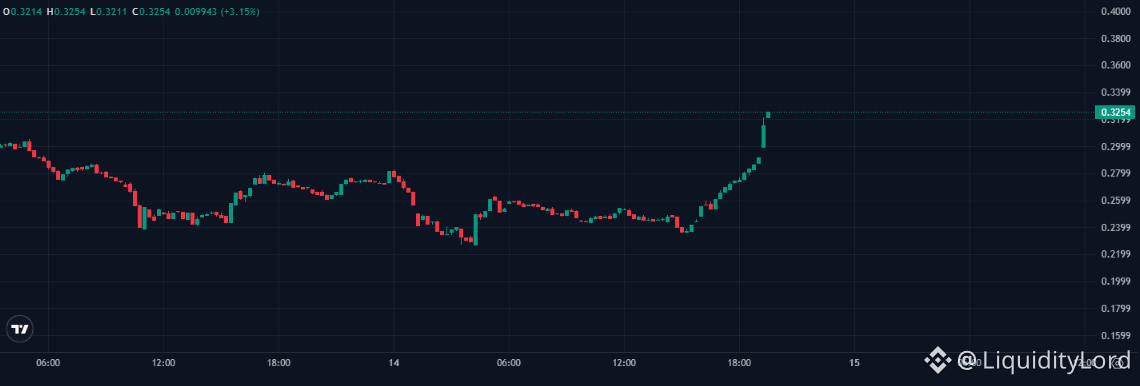
AI/USDT has shifted from a quiet base into a strong upside impulse. Price spent hours rotating around 0.24–0.28, built a higher low near 0.23, then accelerated through 0.28 and 0.30. The latest candles show expansion toward 0.3254, so the key question is whether this move can turn the breakout area into support.
🎯 THE TRADE MAP
Entry: 0.2980–0.3100
Invalidation: 0.2860
TP1: 0.3350
TP2: 0.3600
TP3: 0.3900
The preferred idea is not to chase the vertical candle. A pullback into the 0.30–0.31 region would offer a cleaner test of the breakout. If buyers defend that zone and print another higher low, continuation toward the upper targets becomes more credible.
🔵 MOMENTUM NEEDS A RETEST
The structure has changed quickly: the market moved from compression into expansion, with successive green candles pushing above the previous local highs. Holding above 0.30 keeps the bullish scenario intact. A deeper move back below 0.2860 would weaken the breakout thesis and suggest that the spike was not yet ready to become a sustained trend.
Above 0.3350, attention shifts to 0.36 and then 0.39. Those levels are better treated as reaction zones rather than guaranteed destinations. If volume fades sharply while price remains extended, waiting for a reset can be more disciplined than entering directly into strength.
💧 EXECUTION IS A SEPARATE LAYER
S T O N can add a DeFi execution perspective through liquidity aggregation and route discovery, helping traders compare available paths across fragmented markets. That infrastructure is independent of AI and does not change the chart setup itself.
The setup is bullish while the breakout zone holds, but the first clean retest matters more than the size of the current candle. Patience around confirmation can improve execution quality.
NFA - DYOR
The next decision is whether 0.30 becomes support.
$AI
AI/USDT has shifted from a quiet base into a strong upside impulse. Price spent hours rotating around 0.24–0.28, built a higher low near 0.23, then accelerated through 0.28 and 0.30. The latest candles show expansion toward 0.3254, so the key question is whether this move can turn the breakout area into support.
🎯 THE TRADE MAP
Entry: 0.2980–0.3100
Invalidation: 0.2860
TP1: 0.3350
TP2: 0.3600
TP3: 0.3900
The preferred idea is not to chase the vertical candle. A pullback into the 0.30–0.31 region would offer a cleaner test of the breakout. If buyers defend that zone and print another higher low, continuation toward the upper targets becomes more credible.
🔵 MOMENTUM NEEDS A RETEST
The structure has changed quickly: the market moved from compression into expansion, with successive green candles pushing above the previous local highs. Holding above 0.30 keeps the bullish scenario intact. A deeper move back below 0.2860 would weaken the breakout thesis and suggest that the spike was not yet ready to become a sustained trend.
Above 0.3350, attention shifts to 0.36 and then 0.39. Those levels are better treated as reaction zones rather than guaranteed destinations. If volume fades sharply while price remains extended, waiting for a reset can be more disciplined than entering directly into strength.
💧 EXECUTION IS A SEPARATE LAYER
S T O N can add a DeFi execution perspective through liquidity aggregation and route discovery, helping traders compare available paths across fragmented markets. That infrastructure is independent of AI and does not change the chart setup itself.
The setup is bullish while the breakout zone holds, but the first clean retest matters more than the size of the current candle. Patience around confirmation can improve execution quality.
NFA - DYOR
The next decision is whether 0.30 becomes support.
$AI