How to Read Crypto Charts Like a Pro (The 3-Step Trick) 🧵👇
Ever buy a crypto token right before it crashes? Or sell right before it pumps?
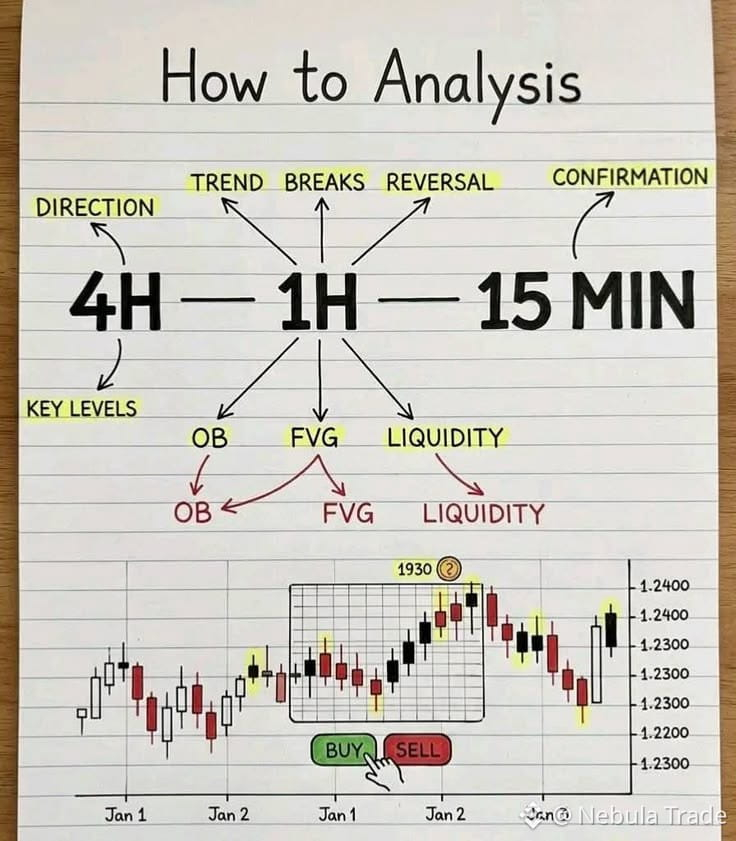
Here is the exact 3-step routine you can use today:
🗺️ Step 1: The 4-Hour Chart (The Map)
Before you do anything, look at the big picture on the 4-Hour (4H) chart.
Your Goal: Find the market's direction. Is the price generally moving up, or is it sliding down?
The Rule: If the 4H chart is moving down, don't try to force a buy. Always swim with the current, not against it.
🎯 Step 2: The 1-Hour Chart (The Target)
Once you know the general direction, zoom in to the 1-Hour (1H) chart to find your battle zone. Look for:
Magnets (FVG): Sudden, fast price jumps leave empty spaces on the chart. Price loves to drift back down to fill these gaps later.
Traps (Liquidity): Notice where ordinary retail traders put their stop-loss orders. Big institutional players love to trigger these traps before reversing the price.
⚡ Step 3: The 15-Minute Chart (The Trigger)
Never jump into a trade blindly. Zoom in all the way to the 15-Minute (15M) chart to wait for your perfect moment.
The Rule: Wait for the price to hit your 1H zone, and watch for a sudden spark of buyer or seller volume.
This keeps your stop-loss tight and your potential profit high.
💡 Quick Lesson: Patience makes money. If the big 4-Hour chart is pointing UP, but the small 15-Minute chart is crashing DOWN, do nothing. Wait for both charts to point in the same direction before you press BUY or SELL.
Which timeframes do you use the most when trading on Binance? Let me know below! 👇
#AvalancheIntegratesIntoUAEPassDigitalVault #UKSeeksViewsOnTokenizingGold #AnthropicCEOCallsForAISlowdown
$FIL
$CAP
$BR
Ever buy a crypto token right before it crashes? Or sell right before it pumps?
Here is the exact 3-step routine you can use today:
🗺️ Step 1: The 4-Hour Chart (The Map)
Before you do anything, look at the big picture on the 4-Hour (4H) chart.
Your Goal: Find the market's direction. Is the price generally moving up, or is it sliding down?
The Rule: If the 4H chart is moving down, don't try to force a buy. Always swim with the current, not against it.
🎯 Step 2: The 1-Hour Chart (The Target)
Once you know the general direction, zoom in to the 1-Hour (1H) chart to find your battle zone. Look for:
Magnets (FVG): Sudden, fast price jumps leave empty spaces on the chart. Price loves to drift back down to fill these gaps later.
Traps (Liquidity): Notice where ordinary retail traders put their stop-loss orders. Big institutional players love to trigger these traps before reversing the price.
⚡ Step 3: The 15-Minute Chart (The Trigger)
Never jump into a trade blindly. Zoom in all the way to the 15-Minute (15M) chart to wait for your perfect moment.
The Rule: Wait for the price to hit your 1H zone, and watch for a sudden spark of buyer or seller volume.
This keeps your stop-loss tight and your potential profit high.
💡 Quick Lesson: Patience makes money. If the big 4-Hour chart is pointing UP, but the small 15-Minute chart is crashing DOWN, do nothing. Wait for both charts to point in the same direction before you press BUY or SELL.
Which timeframes do you use the most when trading on Binance? Let me know below! 👇
#AvalancheIntegratesIntoUAEPassDigitalVault #UKSeeksViewsOnTokenizingGold #AnthropicCEOCallsForAISlowdown
$FIL
$CAP
$BR