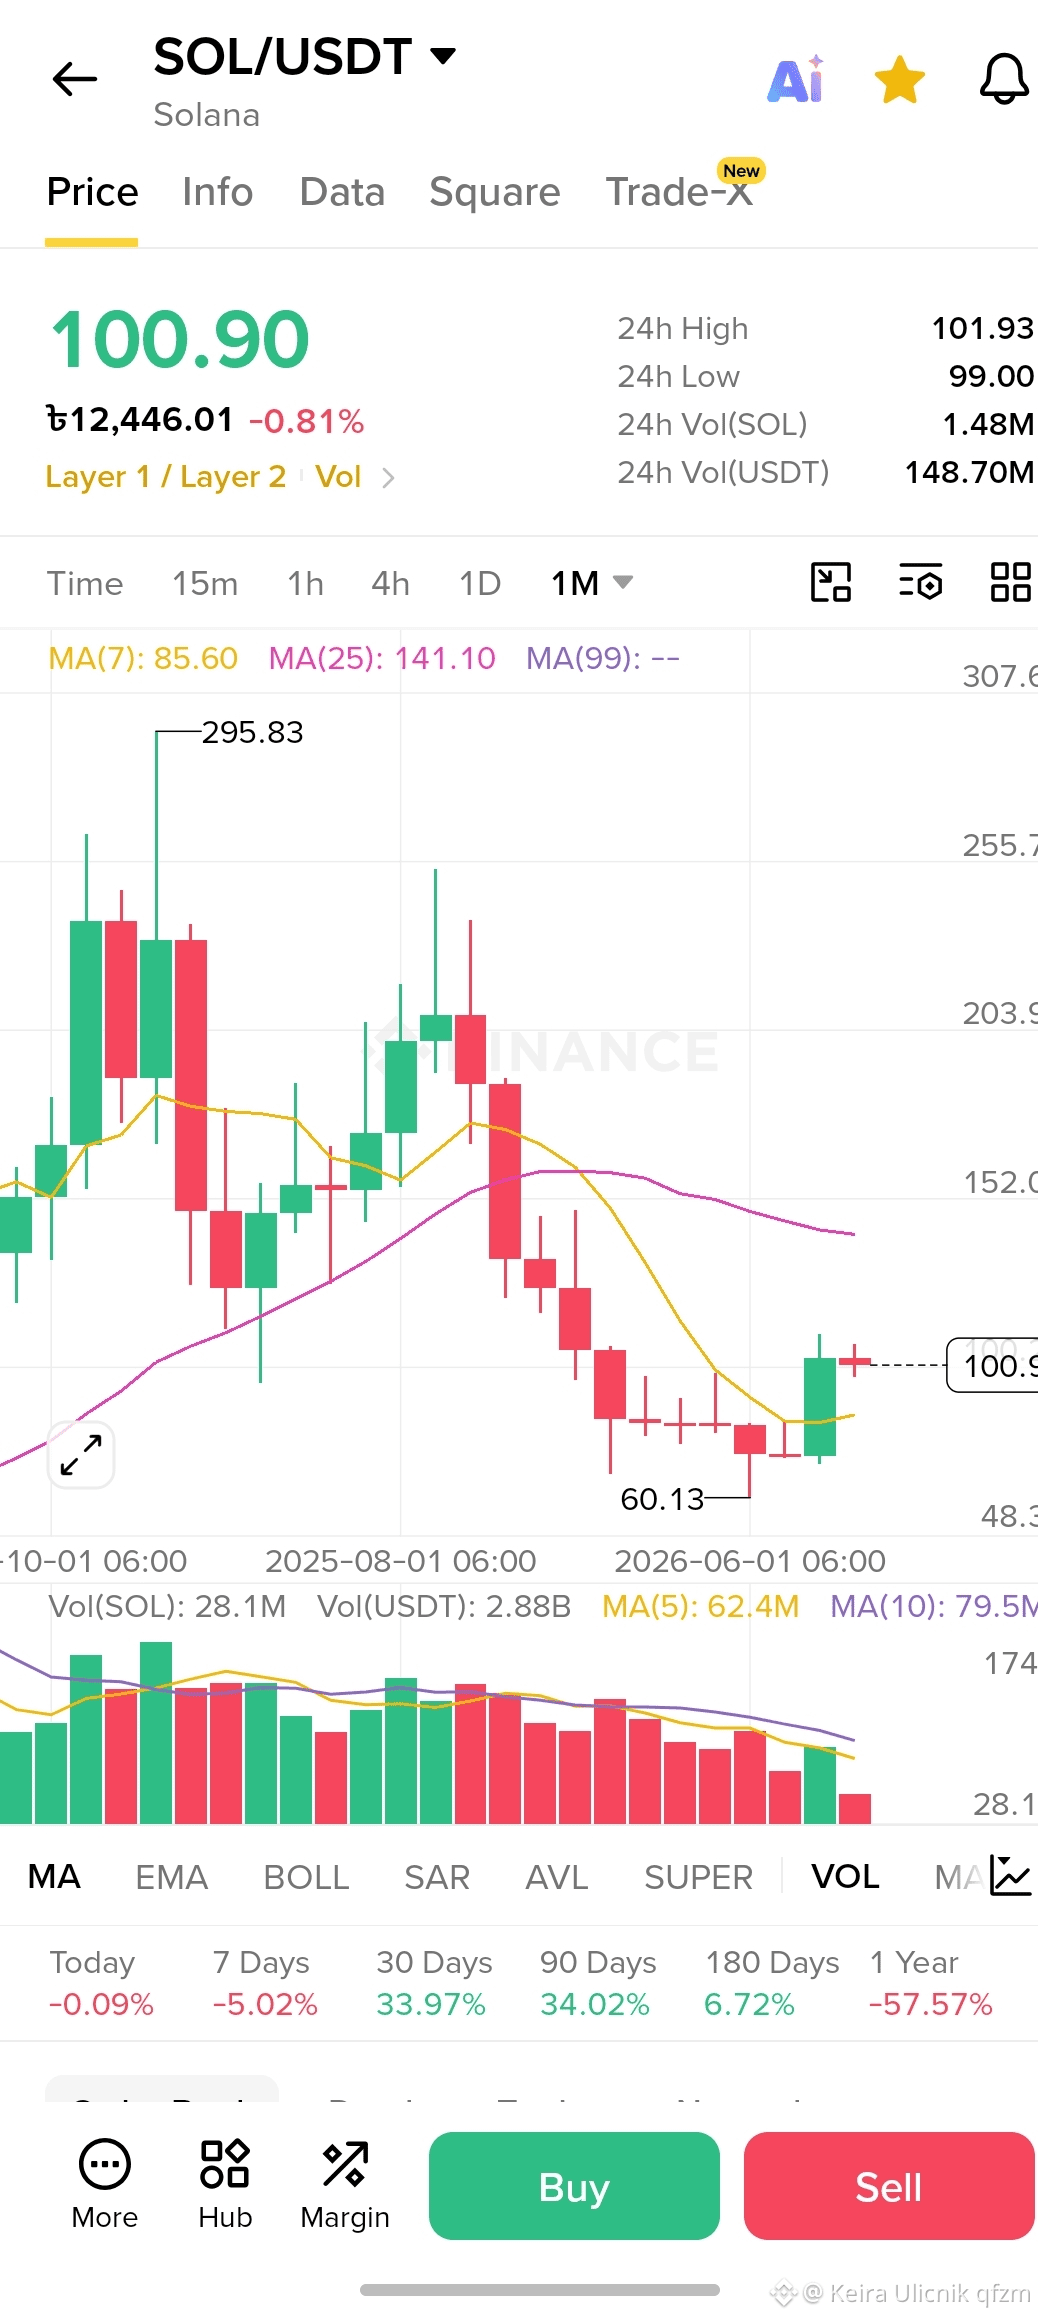
📊 SOL/USDT Monthly Chart Analysis: What’s Next? 📊
Looking at the monthly timeframe, Solana ($SOL) shows signs of momentum recovery after holding a crucial bottom.
Key Technical Observations:
1️⃣ Bottom Reversal: $SOL found strong support at $60.13 and has pulled back over $100.
2️⃣ MA Crossover Zone: Price is now trading above the 7 MA ($85.60), showing short-to-mid-term strength.
3️⃣ Major Resistance Ahead: The 25 MA around $141.10 will be a key target to watch for a full bullish trend confirmation.
⚡ Trading Strategy View:
Bullish Scenario: Sustaining above $100 could lead to a test of $120–$140 range.
Bearish Risk: Losing $85 support could trigger retests toward lower support levels.
What’s your price target for $SOL? Share your thoughts! 💬
#SOL #Crypto #BinanceSquare #TechnicalAnalysis #SOL/USDT📉
Looking at the monthly timeframe, Solana ($SOL) shows signs of momentum recovery after holding a crucial bottom.
Key Technical Observations:
1️⃣ Bottom Reversal: $SOL found strong support at $60.13 and has pulled back over $100.
2️⃣ MA Crossover Zone: Price is now trading above the 7 MA ($85.60), showing short-to-mid-term strength.
3️⃣ Major Resistance Ahead: The 25 MA around $141.10 will be a key target to watch for a full bullish trend confirmation.
⚡ Trading Strategy View:
Bullish Scenario: Sustaining above $100 could lead to a test of $120–$140 range.
Bearish Risk: Losing $85 support could trigger retests toward lower support levels.
What’s your price target for $SOL? Share your thoughts! 💬
#SOL #Crypto #BinanceSquare #TechnicalAnalysis #SOL/USDT📉