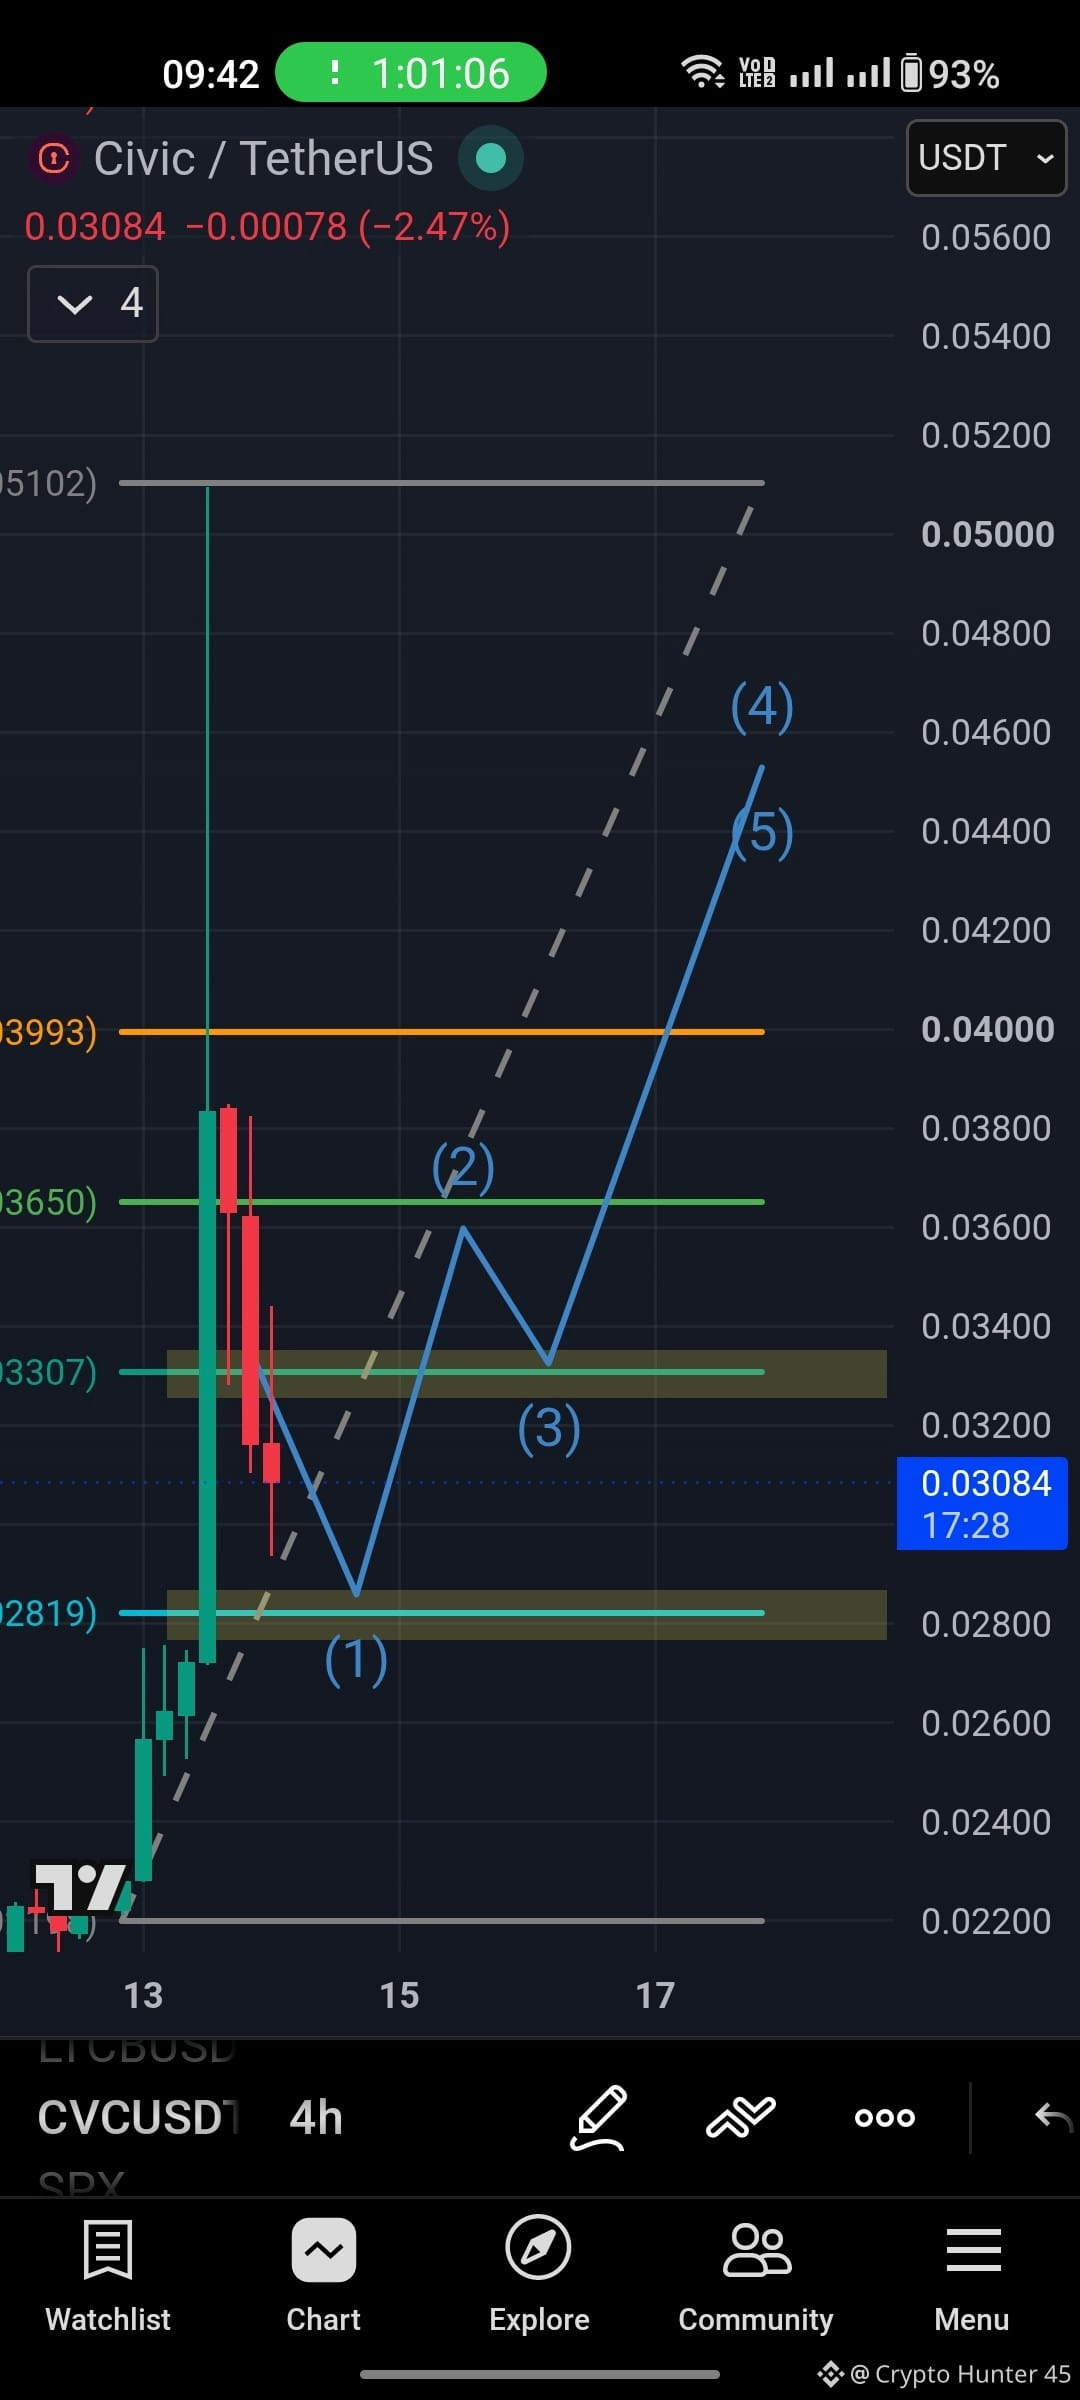
📊 CVC/USDT — 4H Chart Analysis
CVC is currently sitting in an important decision zone. Based on the Elliott Wave structure drawn on your chart, the potential bullish path is:
Current price: ~$0.03084
🟢 Support 1: $0.0282–$0.0284 — key demand zone
🟢 Support 2: $0.0331–$0.0333 — reclaiming this would strengthen momentum
🟡 Resistance: ~$0.0365 — a clean breakout could confirm further upside
🔥 Major resistance: ~$0.0400 — a 4H close above this could trigger a stronger move
🎯 Wave (4)/(5) target: $0.044–$0.046
🚀 Extended target: ~$0.050–$0.051
Possible bullish path
$0.0308 → $0.0282–0.0284 → $0.0332 → $0.0365 → $0.0400 → $0.044–0.046
⚠️ Invalidation: A strong 4H breakdown below $0.0282 would weaken the current bullish wave structure and could lead to further downside.
Bias: 🟡 Neutral-to-Bullish
Confirmation: Above $0.0365, and especially above $0.0400.
Chart-based analysis only — not financial advice.$CVC
CVC is currently sitting in an important decision zone. Based on the Elliott Wave structure drawn on your chart, the potential bullish path is:
Current price: ~$0.03084
🟢 Support 1: $0.0282–$0.0284 — key demand zone
🟢 Support 2: $0.0331–$0.0333 — reclaiming this would strengthen momentum
🟡 Resistance: ~$0.0365 — a clean breakout could confirm further upside
🔥 Major resistance: ~$0.0400 — a 4H close above this could trigger a stronger move
🎯 Wave (4)/(5) target: $0.044–$0.046
🚀 Extended target: ~$0.050–$0.051
Possible bullish path
$0.0308 → $0.0282–0.0284 → $0.0332 → $0.0365 → $0.0400 → $0.044–0.046
⚠️ Invalidation: A strong 4H breakdown below $0.0282 would weaken the current bullish wave structure and could lead to further downside.
Bias: 🟡 Neutral-to-Bullish
Confirmation: Above $0.0365, and especially above $0.0400.
Chart-based analysis only — not financial advice.$CVC