Today’s #data ‼️
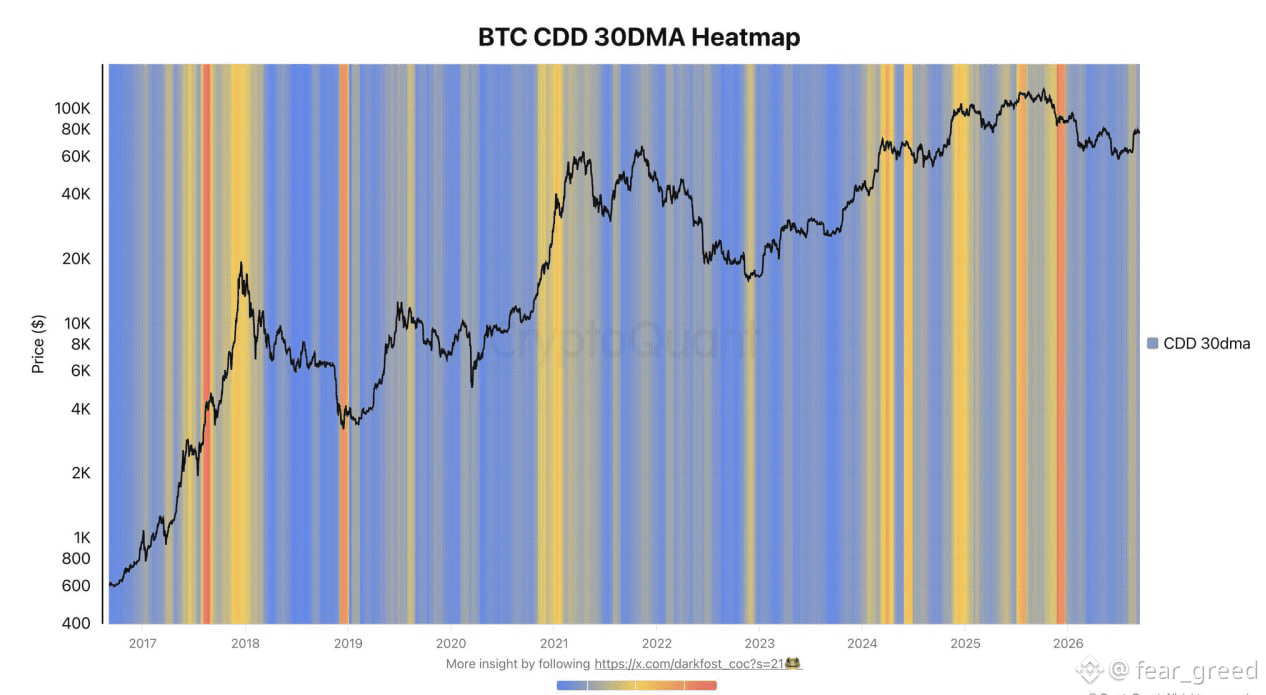
Long-term holders (LTHs) have likely been at their most active during this cycle.
This heatmap tracks LTH activity via the CDD (Coin Days Destroyed) metric. It is a simple indicator that calculates the number of days bitcoins were held prior to being moved (i.e., the spending of a UTXO).
The logic is as follows: when LTHs move their bitcoins, it often signals an intention to sell.
Their activity has increased during the current cycle—likely due to the availability of liquidity driven by factors such as the launch of ETFs and the actions of companies building Bitcoin reserves.
However, it is worth noting that spikes in activity do not occur solely at price peaks; episodes of capitulation have also been observed.
On the other hand, sharp surges in CDD can also stem from the movement of large volumes of BTC—such as the Coinbase transactions involving the transfer of 800,000 BTC (a significant portion of which had been held for over six months)—though such instances are somewhat idiosyncratic.
Recently, amidst the rise in Bitcoin's price, LTHs have shown a slight uptick in activity—likely chasing quick profits—but the overall situation on this front remains relatively quiet.
Long-term holders are biding their time.
Long-term holders (LTHs) have likely been at their most active during this cycle.
This heatmap tracks LTH activity via the CDD (Coin Days Destroyed) metric. It is a simple indicator that calculates the number of days bitcoins were held prior to being moved (i.e., the spending of a UTXO).
The logic is as follows: when LTHs move their bitcoins, it often signals an intention to sell.
Their activity has increased during the current cycle—likely due to the availability of liquidity driven by factors such as the launch of ETFs and the actions of companies building Bitcoin reserves.
However, it is worth noting that spikes in activity do not occur solely at price peaks; episodes of capitulation have also been observed.
On the other hand, sharp surges in CDD can also stem from the movement of large volumes of BTC—such as the Coinbase transactions involving the transfer of 800,000 BTC (a significant portion of which had been held for over six months)—though such instances are somewhat idiosyncratic.
Recently, amidst the rise in Bitcoin's price, LTHs have shown a slight uptick in activity—likely chasing quick profits—but the overall situation on this front remains relatively quiet.
Long-term holders are biding their time.