
One day you wake up and APT is hitting $20 again. That sounds crazy when you look at the chart today.
APT launched with the kind of attention every new L1 wanted. Price pushed all the way to $20.40 and that became the number everyone remembered.
Then the market changed.
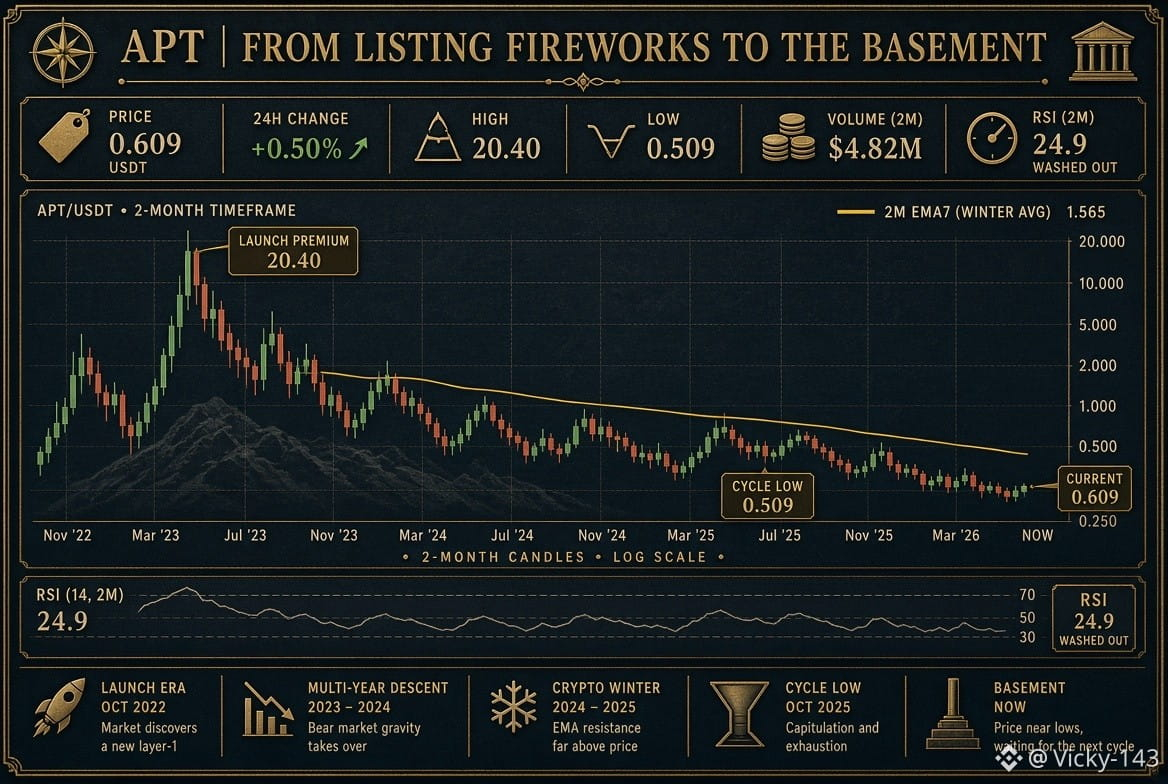
The 2-month chart tells the story clearly. Lower highs. Lower lows. Every bounce lost strength and the long decline kept going.
Now APT is around $0.609 after touching a cycle low near $0.509. Daily volume is only around $4.82M. Nothing like the excitement we saw during the early days.
The part that really stands out to me is the EMA7 sitting around $1.57 while price is still far below it.
That tells me the bigger trend has not changed yet.
RSI at 24.9 shows how heavily the chart has been sold. That can signal exhaustion but it does not mean the downtrend is over.
For me the important levels are simple.
$0.51 is the level I want to see hold.
$1.57 is where the chart would start giving me real evidence that the long downtrend is changing.
Until then I’m not interested in guessing the bottom.
APT already showed what hype can do.
Now the chart has to show what structure can do.
History first. Confirmation second.
$APT
APT launched with the kind of attention every new L1 wanted. Price pushed all the way to $20.40 and that became the number everyone remembered.
Then the market changed.
The 2-month chart tells the story clearly. Lower highs. Lower lows. Every bounce lost strength and the long decline kept going.
Now APT is around $0.609 after touching a cycle low near $0.509. Daily volume is only around $4.82M. Nothing like the excitement we saw during the early days.
The part that really stands out to me is the EMA7 sitting around $1.57 while price is still far below it.
That tells me the bigger trend has not changed yet.
RSI at 24.9 shows how heavily the chart has been sold. That can signal exhaustion but it does not mean the downtrend is over.
For me the important levels are simple.
$0.51 is the level I want to see hold.
$1.57 is where the chart would start giving me real evidence that the long downtrend is changing.
Until then I’m not interested in guessing the bottom.
APT already showed what hype can do.
Now the chart has to show what structure can do.
History first. Confirmation second.
$APT