$BTC /USDT Short-Term Technical Update (5m Timeframe) ⚡
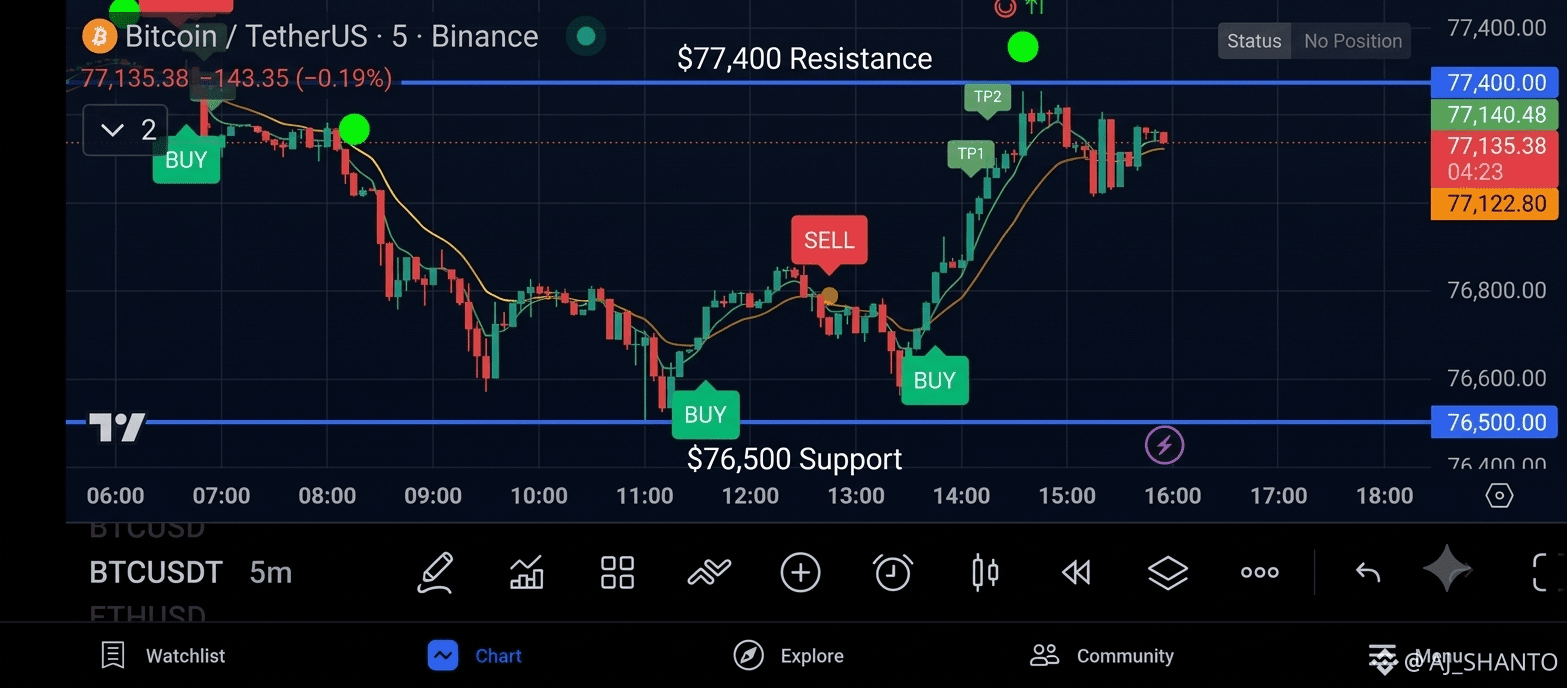
Bitcoin is showing strong intraday recovery after bouncing back firmly from the $76,500 - $76,600 local demand zone! 📈
🔍 Technical Highlights:
• Current Price: ~$77,140
• Immediate Resistance: $77,400 - $77,500
• Key Support Level: $76,500
💡 Analysis & Strategy:
The 5-minute timeframe indicates a clean bullish continuation following the sweep of lower liquidity. If $BTC breaks and holds above the $77,400 resistance level, we could see a quick momentum leg higher toward $77,800.
⚠️ Risk Management: A breakdown below $76,500 invalidates this short-term bullish structure. Always trade with tight Stop Loss and proper risk management!
Click $BTC below to check the real-time chart and manage your position! 👇
What’s your next move for BTC? Let me know in the comments! 💬
#BTC #TradingAnalysis #BinanceSquare #CryptoTrading #TechnicalAnalysis
Bitcoin is showing strong intraday recovery after bouncing back firmly from the $76,500 - $76,600 local demand zone! 📈
🔍 Technical Highlights:
• Current Price: ~$77,140
• Immediate Resistance: $77,400 - $77,500
• Key Support Level: $76,500
💡 Analysis & Strategy:
The 5-minute timeframe indicates a clean bullish continuation following the sweep of lower liquidity. If $BTC breaks and holds above the $77,400 resistance level, we could see a quick momentum leg higher toward $77,800.
⚠️ Risk Management: A breakdown below $76,500 invalidates this short-term bullish structure. Always trade with tight Stop Loss and proper risk management!
Click $BTC below to check the real-time chart and manage your position! 👇
What’s your next move for BTC? Let me know in the comments! 💬
#BTC #TradingAnalysis #BinanceSquare #CryptoTrading #TechnicalAnalysis