
Binance Square | Market Analysis · Trading Setup
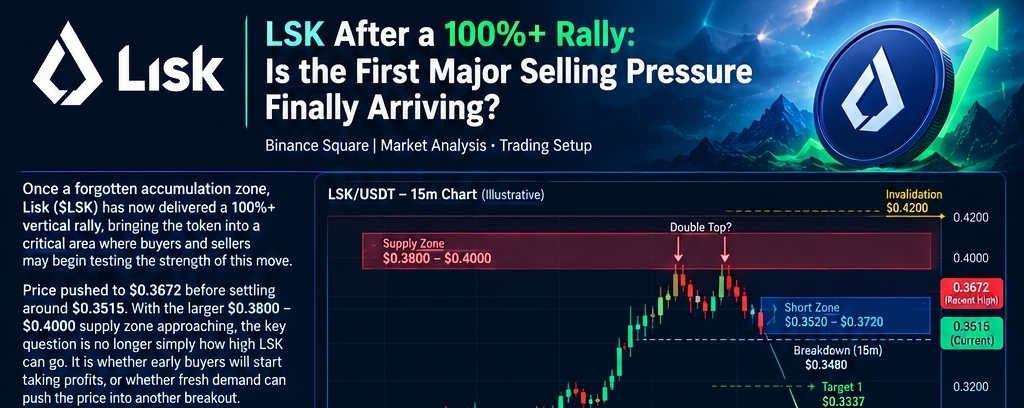
Once a forgotten accumulation zone, Lisk ($LSK ) has now delivered a 100%+ vertical rally, bringing the token into a critical area where buyers and sellers may begin testing the strength of this move.
Price pushed to $0.3672 before settling around $0.3515. With the larger $0.3800–$0.4000 supply zone approaching, the key question is no longer simply how high LSK can go. It is whether early buyers will start taking profits, or whether fresh demand can push the price into another breakout.
For me, this is not the place to chase green candles. After such an aggressive move, I would rather watch the supply zone, selling pressure, and confirmation before considering a trade.
Why This Area Matters After the Rally
When a token breaks out of a long accumulation range and moves sharply higher, market conditions can change. During accumulation, buyers may have had the opportunity to build positions at relatively lower prices. After a major rally, however, some of those buyers may start taking profits, while new traders may hesitate to enter at elevated levels.
The important point is that a 100%+ rally does not automatically mean a correction is coming. At the same time, a strong rally does not guarantee that the price will continue higher. The next move will depend on whether buyers can hold the breakout, whether new demand continues to develop, and how sellers respond around the supply zone.
$LSK Price Action: Buyers Are Approaching a Major Test
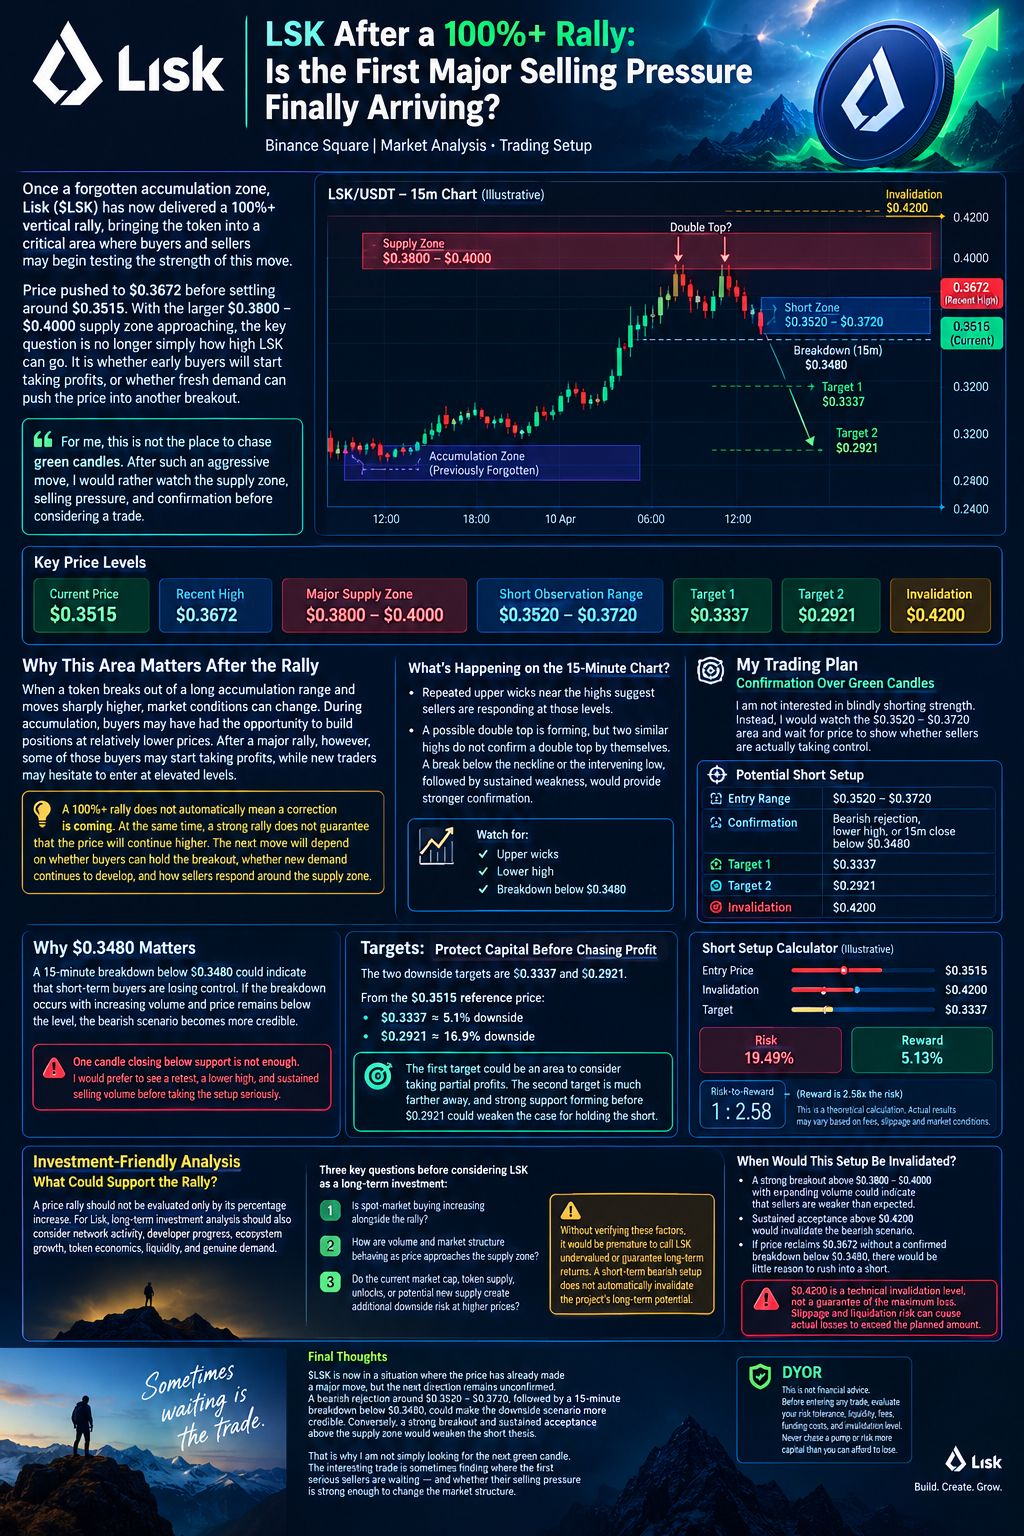
The current setup is built around the price levels mentioned in the market snapshot:
Recent high: $0.3672
Current reference price: $0.3515
Major supply zone: $0.3800–$0.4000
Potential short observation range: $0.3520–$0.3720
From $0.3515, the lower boundary of the supply zone is approximately 8.1% higher, while the upper boundary is around 13.8% higher.
This makes the area worth watching, but not an automatic sell signal. A supply zone represents a potential area of selling interest, not a guaranteed reversal point.
1. $0.3800–$0.4000: The First Major Barrier
This range is currently one of the most important areas to monitor. Previous sellers or profit-taking traders may become active here, but the actual strength of the zone must be confirmed through price action and volume.
If LSK reaches this area and repeatedly fails to move higher, it could indicate that fresh demand is weakening at elevated prices. On the other hand, a strong breakout above the zone with expanding volume could turn previous resistance into potential support.
2. What Is Happening on the 15-Minute Chart?
The recent price action shows repeated upper wicks near the highs, according to the provided setup. This may suggest that buyers are pushing price higher, but sellers are responding around those levels.
A possible double top is also forming near the highs. However, two similar highs do not confirm a double top by themselves. A break below the neckline or the intervening low, followed by sustained weakness, would provide stronger confirmation.
My Trading Plan: Confirmation Over Green Candles
I am not interested in blindly shorting strength. Instead, I would watch the $0.3520–$0.3720 area and wait for price to show whether sellers are actually taking control.
Potential Short Setup
Entry observation range: $0.3520–$0.3720
Confirmation: A bearish rejection, lower high, or a confirmed 15-minute breakdown below $0.3480.
First target: $0.3337
Second target: $0.2921
Invalidation: $0.4200
These are conditional trading levels from the original setup, not guaranteed entry prices or profit targets.
Why $0.3480 Matters
A 15-minute breakdown below $0.3480 could indicate that short-term buyers are losing control. If the breakdown occurs with increasing volume and price remains below the level, the bearish scenario becomes more credible.
But one candle closing below support is not enough for me to enter a short. Fast-moving tokens often sweep liquidity before reversing back into the previous range. That is why I would prefer to see a retest, a lower high, and sustained selling volume before taking the setup seriously.
Targets: Protect Capital Before Chasing Profit
The two downside targets are $0.3337 and $0.2921.
From the $0.3515 reference price:
$0.3337 represents approximately 5.1% downside.
$0.2921 represents approximately 16.9% downside.
The first target could be an area to consider taking partial profits if the trade confirms. The second target is much farther away, and strong support forming before $0.2921 could weaken the case for holding the short.
A good risk-management plan should define the invalidation before entering. With a fast-moving token, slippage, funding fees, and liquidation risk can make the actual loss larger than expected. That is why I would avoid excessive leverage and calculate position size based on the amount I am willing to lose.
Investment-Friendly Analysis: What Could Support the Rally?
A price rally should not be evaluated only by its percentage increase. For Lisk, long-term investment analysis should also consider network activity, developer progress, ecosystem growth, token economics, liquidity, and genuine demand.
Lisk is a blockchain project, and its long-term valuation depends on whether the network can build meaningful utility and attract sustained activity. However, a 100%+ price increase does not mean that its underlying value has increased by the same amount.
Before considering LSK as a long-term investment, I would focus on three questions:
Is spot-market buying increasing alongside the rally?
How are volume and market structure behaving as price approaches the supply zone?
Do the current market capitalization, token supply, unlocks, or potential new supply create additional downside risk at higher prices?
Without verifying these factors, it would be premature to call LSK undervalued or guarantee long-term returns. A short-term bearish setup also does not automatically invalidate the project's long-term potential.
When Would This Setup Be Invalidated?
The most important part of a short trade is knowing when the thesis is wrong.
A strong breakout above $0.3800–$0.4000 with expanding volume could indicate that sellers are weaker than expected.
Sustained acceptance above $0.4200 would invalidate the bearish scenario described in this setup.
If price reclaims $0.3672 without a confirmed breakdown below $0.3480, there would be little reason to rush into a short.
One important distinction: $0.4200 is a technical invalidation level, not a guarantee of the maximum loss. Slippage and liquidation risk can cause actual losses to exceed the planned amount, especially in highly volatile tokens.
Final Thoughts: Sometimes Waiting Is the Trade
For me, LSK is now in a situation where the price has already made a major move, but the next direction remains unconfirmed.
A bearish rejection around $0.3520–$0.3720, followed by a 15-minute breakdown below $0.3480, could make the downside scenario more credible. Conversely, a strong breakout and sustained acceptance above the supply zone would weaken the short thesis.
That is why I am not simply looking for the next green candle.
After a rally this aggressive, the interesting trade is sometimes not finding where the next buyers are waiting.
It is finding where the first serious sellers are waiting—and whether their selling pressure is strong enough to change the market structure.
DYOR: This is not financial advice. Before entering any trade, evaluate your risk tolerance, liquidity, fees, funding costs, and invalidation level. Never chase a pump or risk more capital than you can afford to lose.