$ETH /USDT Technical Analysis — 13 Sep 2026
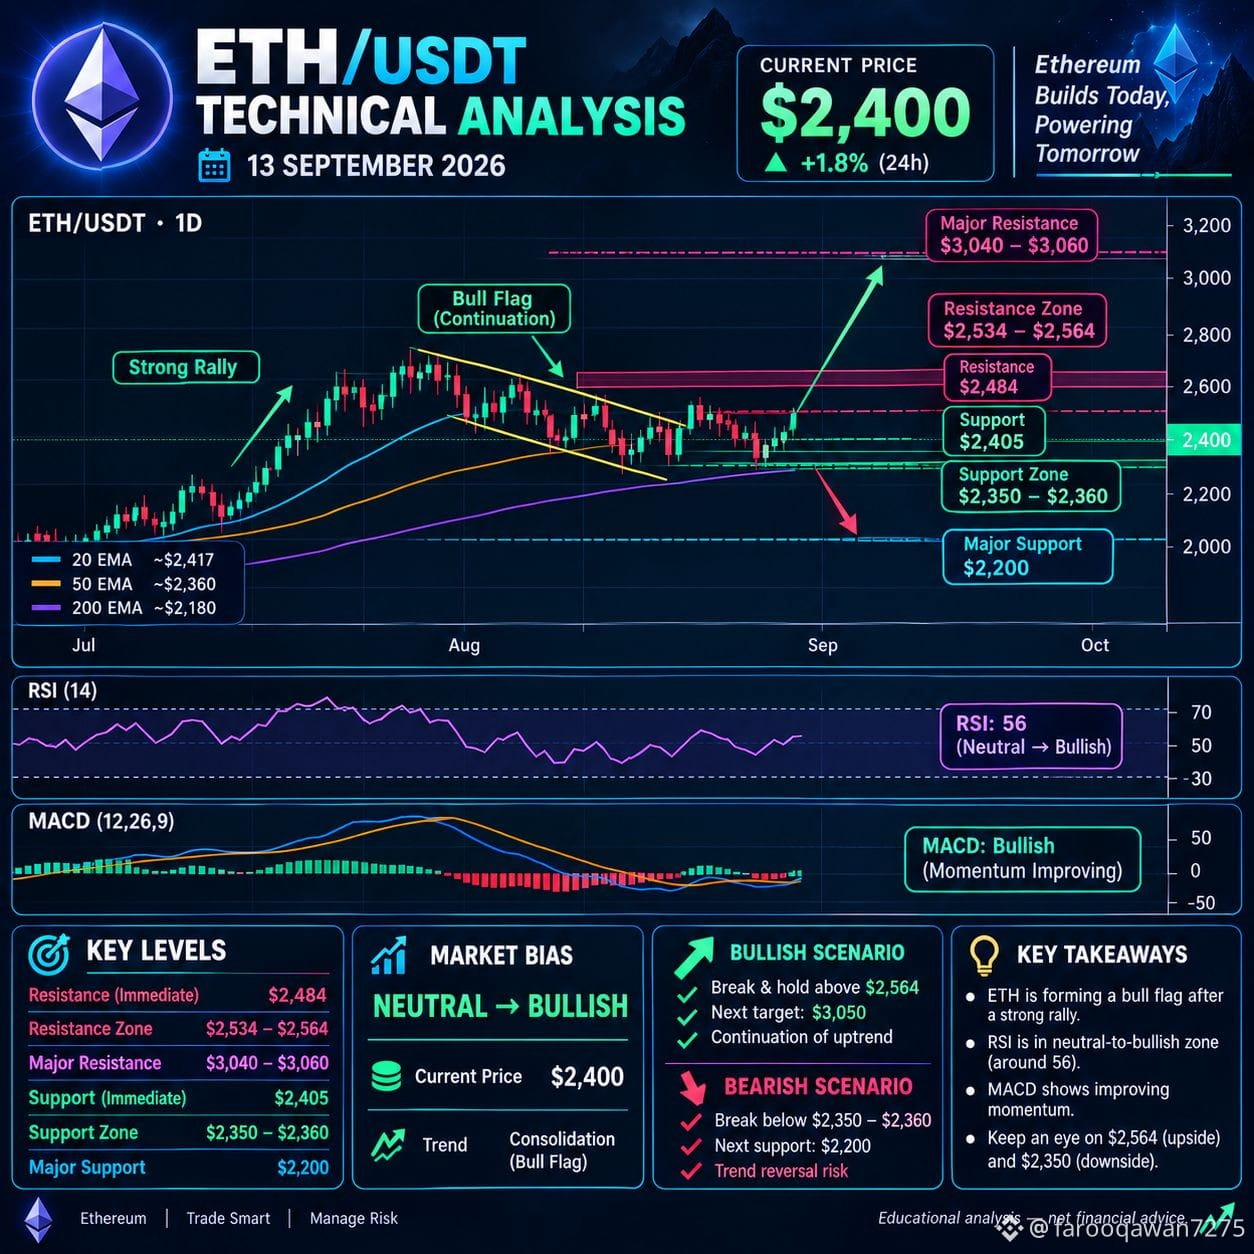
ETH is currently around $2,480–$2,520. Recent price action is a pullback/consolidation after the strong rally that took ETH to about $2,564. Reuters notes that the structure resembles a bull flag, with a potential upside target around $3,050 if the pattern confirms. �
📊 Key Levels
Resistance
🔴 $2,550–$2,565 — major immediate resistance
🔴 $2,600–$2,650 — breakout zone
🔴 $2,800 — next major target
🚀 $3,040–$3,060 — major target if bull flag breaks upward �
Support
🟢 $2,435–$2,450 — important support
🟢 $2,350–$2,360 — key trend support
🟢 $2,200–$2,250 — stronger downside support
🟢 $2,000 — major psychological support
ETH's $2,438 area is particularly important because it corresponds with a key Fibonacci retracement level. �
BeInCrypto
📈 Bullish Scenario
If ETH holds $2,435–$2,450 and breaks $2,565 with strong volume:
$2,650 → $2,800 → $2,920 → $3,050
A clean breakout above $2,565 would significantly strengthen the bullish setup.
📉 Bearish Scenario
If ETH loses $2,435, especially with a daily close below $2,350, downside could open toward:
$2,250 → $2,200 → $2,000
Current short-term indicators are mixed: RSI is around the neutral zone, while several momentum indicators are showing selling pressure. Meanwhile, longer moving averages remain supportive around the $2,490–$2,505 region. �
🎯 My Trading Bias
Short-term: 🟡 Neutral / slightly bearish
Medium-term: 🟢 Bullish while $2,350–$2,360 holds
Potential LONG: Wait for a confirmed reclaim of $2,550–$2,565.
Potential SHORT: Consider only after a confirmed breakdown below $2,435, with confirmation.
#SECReceivesGrayscaleLitecoinTrustETFFiling #ClarityActFacesProceduralVoteSept15 #US10YearTreasuryYieldNears5%
ETH is currently around $2,480–$2,520. Recent price action is a pullback/consolidation after the strong rally that took ETH to about $2,564. Reuters notes that the structure resembles a bull flag, with a potential upside target around $3,050 if the pattern confirms. �
📊 Key Levels
Resistance
🔴 $2,550–$2,565 — major immediate resistance
🔴 $2,600–$2,650 — breakout zone
🔴 $2,800 — next major target
🚀 $3,040–$3,060 — major target if bull flag breaks upward �
Support
🟢 $2,435–$2,450 — important support
🟢 $2,350–$2,360 — key trend support
🟢 $2,200–$2,250 — stronger downside support
🟢 $2,000 — major psychological support
ETH's $2,438 area is particularly important because it corresponds with a key Fibonacci retracement level. �
BeInCrypto
📈 Bullish Scenario
If ETH holds $2,435–$2,450 and breaks $2,565 with strong volume:
$2,650 → $2,800 → $2,920 → $3,050
A clean breakout above $2,565 would significantly strengthen the bullish setup.
📉 Bearish Scenario
If ETH loses $2,435, especially with a daily close below $2,350, downside could open toward:
$2,250 → $2,200 → $2,000
Current short-term indicators are mixed: RSI is around the neutral zone, while several momentum indicators are showing selling pressure. Meanwhile, longer moving averages remain supportive around the $2,490–$2,505 region. �
🎯 My Trading Bias
Short-term: 🟡 Neutral / slightly bearish
Medium-term: 🟢 Bullish while $2,350–$2,360 holds
Potential LONG: Wait for a confirmed reclaim of $2,550–$2,565.
Potential SHORT: Consider only after a confirmed breakdown below $2,435, with confirmation.
#SECReceivesGrayscaleLitecoinTrustETFFiling #ClarityActFacesProceduralVoteSept15 #US10YearTreasuryYieldNears5%