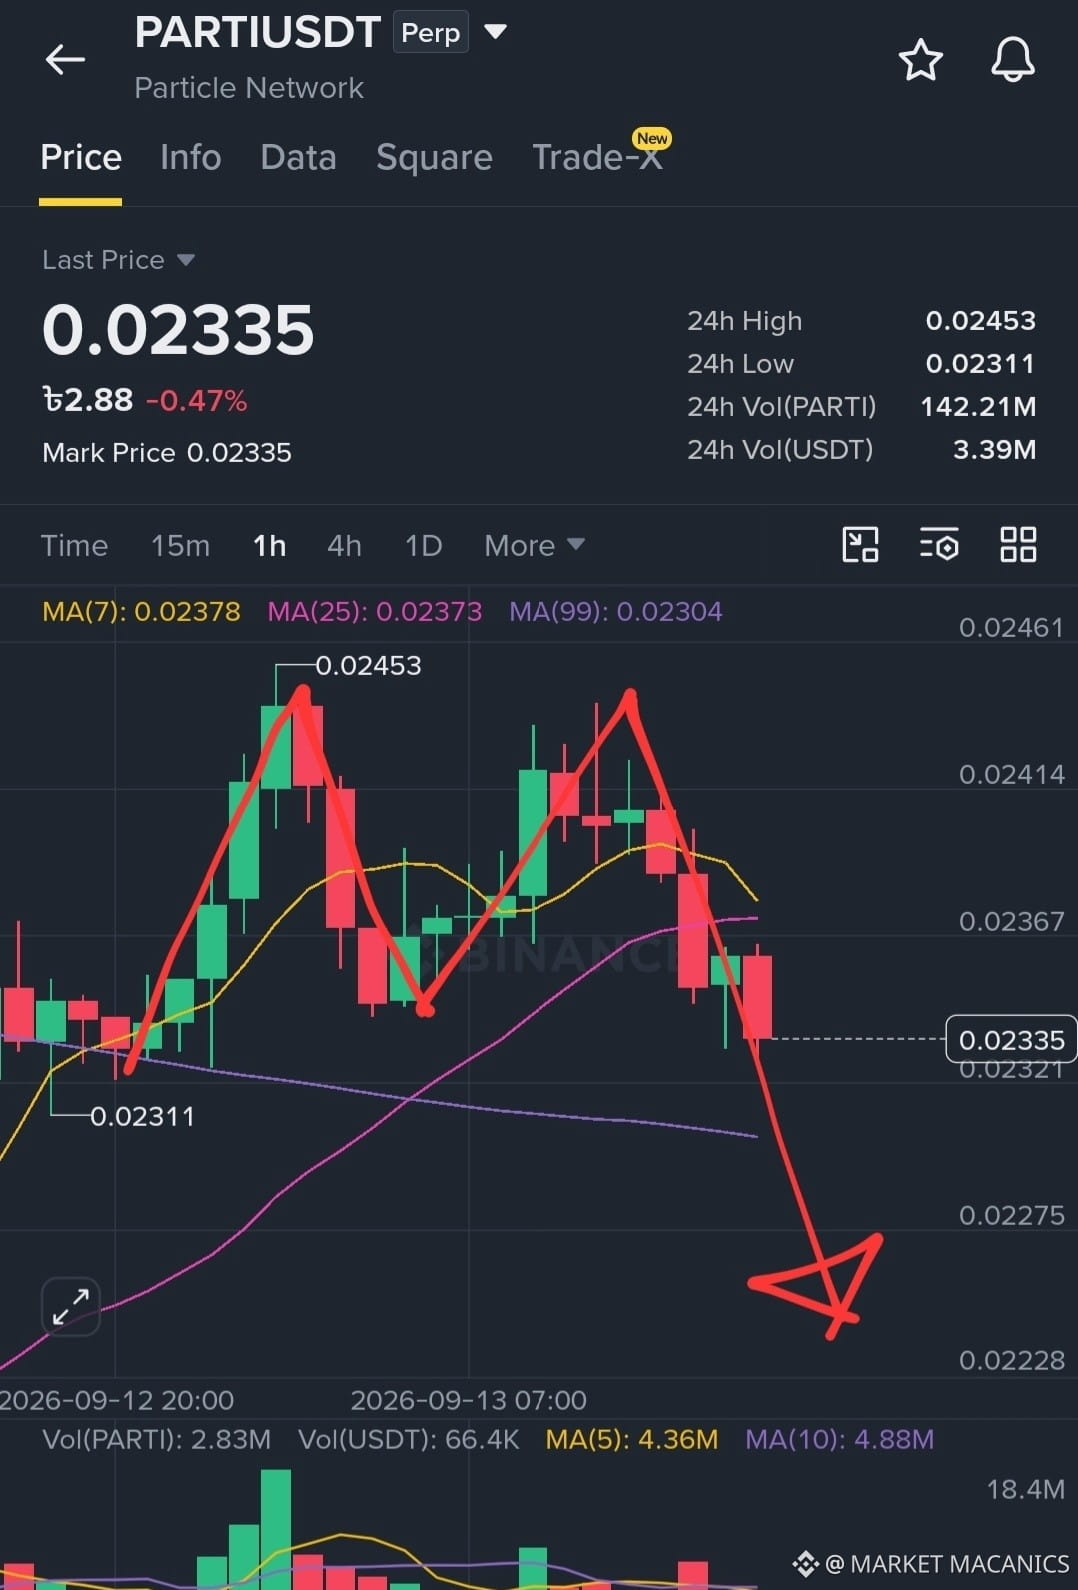
$PARTI PARTI Bearish M Pattern: Sellers Target the Neckline 📉
The PARTI chart is developing a bearish M pattern, suggesting that buying momentum may be weakening after repeated attempts to push higher. 📉 The formation typically appears when price creates two significant peaks with a pullback between them, followed by another rejection near the first high. This second failure can signal weakening demand and increasing seller pressure. The support connecting the two lows becomes the critical neckline and the main confirmation level for the bearish setup.
For an actionable short setup, traders should wait for confirmation rather than entering simply because the M pattern is visible. A potential short entry can be considered after PARTI decisively breaks below the neckline with strong selling volume. 🔻 A safer trigger is a breakdown followed by a failed retest, where the former support becomes resistance. If price rejects that level and resumes moving lower, it provides stronger evidence that sellers have taken control and that bearish continuation may be developing.
Once the breakdown is confirmed, traders can structure three downside targets around successive support and demand zones. 🎯 Target 1 should be the nearest meaningful support below the neckline. Target 2 can target the next established demand region, while Target 3 can focus on a deeper historical support zone if selling momentum accelerates. Scaling out at each level can lock in profits progressively while keeping part of the position open for a potential extended decline.
Risk management remains essential because an M pattern can fail if buyers reclaim the neckline. ⚠️ A stop-loss can generally be placed above the failed-retest zone or the latest significant lower high. If PARTI recovers above the neckline and begins forming higher highs, the bearish thesis becomes invalid or significantly weaker.
$STEEM
$LSK
The PARTI chart is developing a bearish M pattern, suggesting that buying momentum may be weakening after repeated attempts to push higher. 📉 The formation typically appears when price creates two significant peaks with a pullback between them, followed by another rejection near the first high. This second failure can signal weakening demand and increasing seller pressure. The support connecting the two lows becomes the critical neckline and the main confirmation level for the bearish setup.
For an actionable short setup, traders should wait for confirmation rather than entering simply because the M pattern is visible. A potential short entry can be considered after PARTI decisively breaks below the neckline with strong selling volume. 🔻 A safer trigger is a breakdown followed by a failed retest, where the former support becomes resistance. If price rejects that level and resumes moving lower, it provides stronger evidence that sellers have taken control and that bearish continuation may be developing.
Once the breakdown is confirmed, traders can structure three downside targets around successive support and demand zones. 🎯 Target 1 should be the nearest meaningful support below the neckline. Target 2 can target the next established demand region, while Target 3 can focus on a deeper historical support zone if selling momentum accelerates. Scaling out at each level can lock in profits progressively while keeping part of the position open for a potential extended decline.
Risk management remains essential because an M pattern can fail if buyers reclaim the neckline. ⚠️ A stop-loss can generally be placed above the failed-retest zone or the latest significant lower high. If PARTI recovers above the neckline and begins forming higher highs, the bearish thesis becomes invalid or significantly weaker.
$STEEM
$LSK