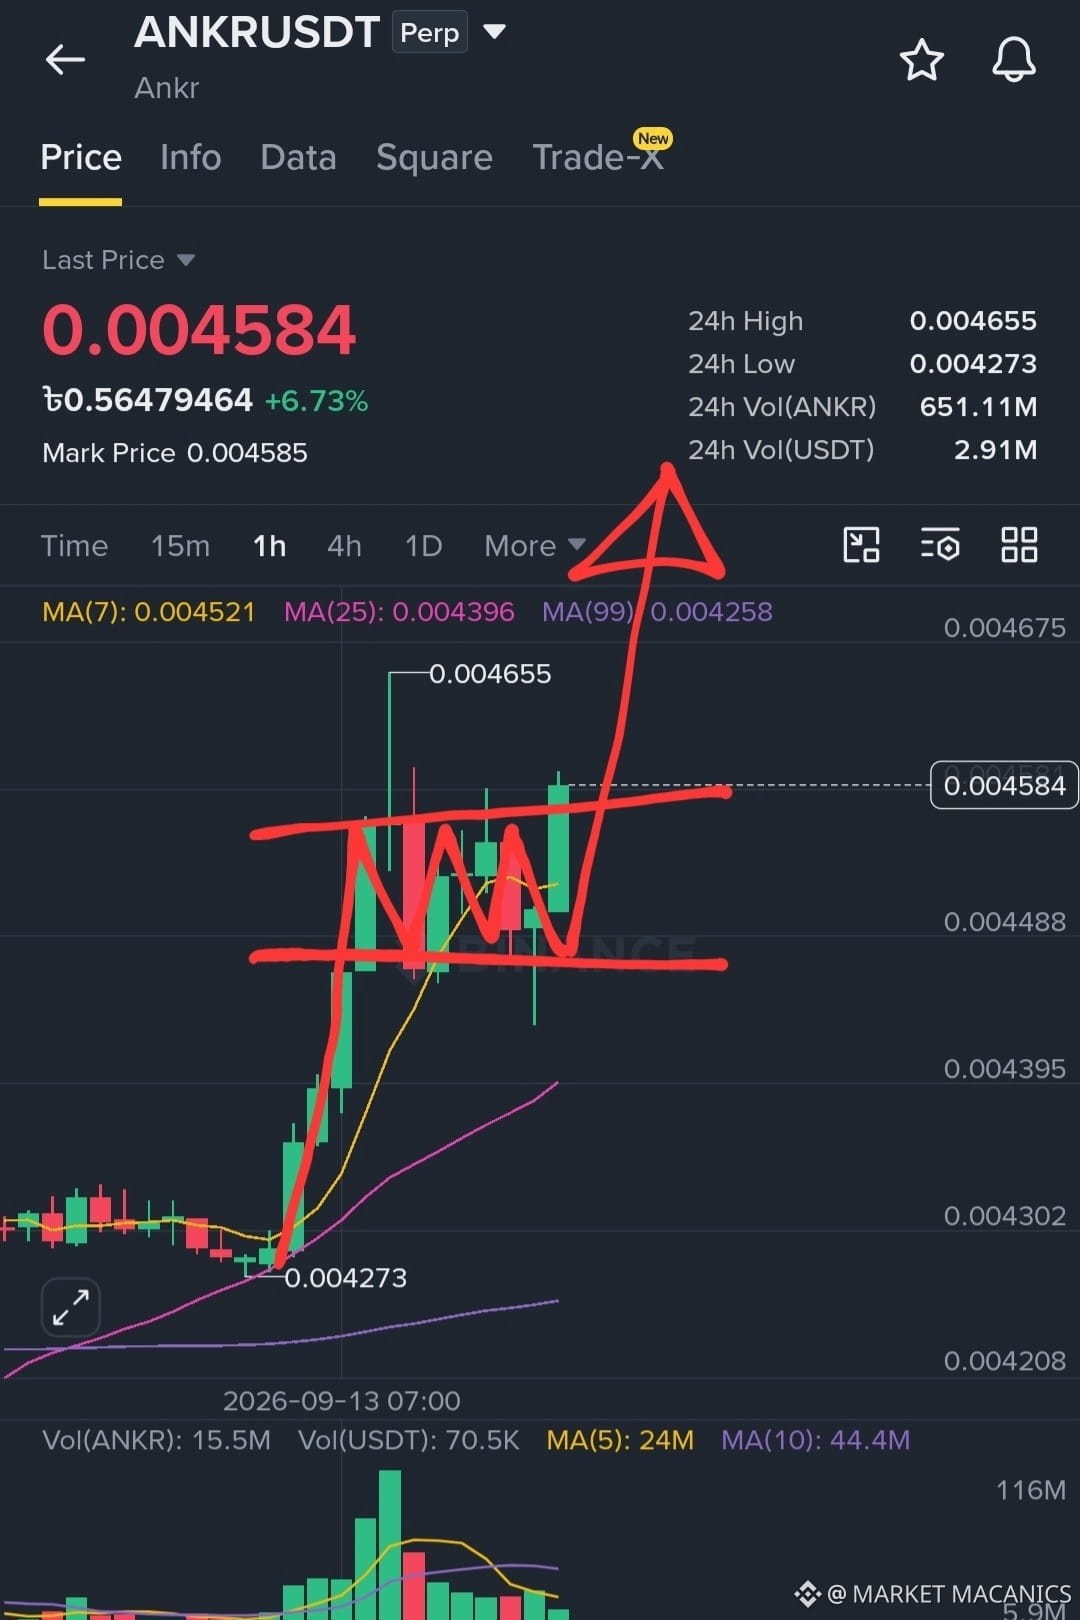
$ANKR ANKR Bullish Flag: Buyers Prepare for a Breakout 🚀
The ANKR chart is developing a bullish flag structure, suggesting that buyers may be preparing for another upward move after a strong advance. 📈 A bullish flag typically forms when price pauses inside a controlled pullback or downward-sloping range while the broader bullish structure remains intact. This consolidation can absorb short-term selling pressure and allow buyers to build momentum before attempting another breakout toward higher resistance zones.
For an actionable long setup, traders should wait for confirmation rather than entering simply because the pattern is visible. The preferred trigger is a decisive breakout above the flag’s upper boundary accompanied by increasing volume. 🔥 An even stronger setup develops if ANKR breaks resistance and then successfully retests the breakout area as support. If price quickly falls back inside the flag, the breakout should be treated cautiously as a potential false signal.
Once the breakout is confirmed, traders can establish three upside targets using the next visible resistance and supply zones. 🎯 Target 1 should be the nearest significant resistance above the breakout. Target 2 can target the following major supply region, while Target 3 can focus on a broader upside extension if bullish momentum continues. Scaling out at each target can secure profits progressively while leaving part of the position open for a stronger continuation move.
Risk management remains critical. ⚠️ A stop-loss can generally be placed below the flag’s lower boundary or beneath the latest meaningful higher low. If ANKR breaks below the flag and begins forming lower lows, the bullish thesis weakens or becomes invalid. Traders should also monitor volume closely because a breakout without strong participation can struggle to maintain momentum and may quickly reverse.
$STEEM
$LSK
The ANKR chart is developing a bullish flag structure, suggesting that buyers may be preparing for another upward move after a strong advance. 📈 A bullish flag typically forms when price pauses inside a controlled pullback or downward-sloping range while the broader bullish structure remains intact. This consolidation can absorb short-term selling pressure and allow buyers to build momentum before attempting another breakout toward higher resistance zones.
For an actionable long setup, traders should wait for confirmation rather than entering simply because the pattern is visible. The preferred trigger is a decisive breakout above the flag’s upper boundary accompanied by increasing volume. 🔥 An even stronger setup develops if ANKR breaks resistance and then successfully retests the breakout area as support. If price quickly falls back inside the flag, the breakout should be treated cautiously as a potential false signal.
Once the breakout is confirmed, traders can establish three upside targets using the next visible resistance and supply zones. 🎯 Target 1 should be the nearest significant resistance above the breakout. Target 2 can target the following major supply region, while Target 3 can focus on a broader upside extension if bullish momentum continues. Scaling out at each target can secure profits progressively while leaving part of the position open for a stronger continuation move.
Risk management remains critical. ⚠️ A stop-loss can generally be placed below the flag’s lower boundary or beneath the latest meaningful higher low. If ANKR breaks below the flag and begins forming lower lows, the bullish thesis weakens or becomes invalid. Traders should also monitor volume closely because a breakout without strong participation can struggle to maintain momentum and may quickly reverse.
$STEEM
$LSK