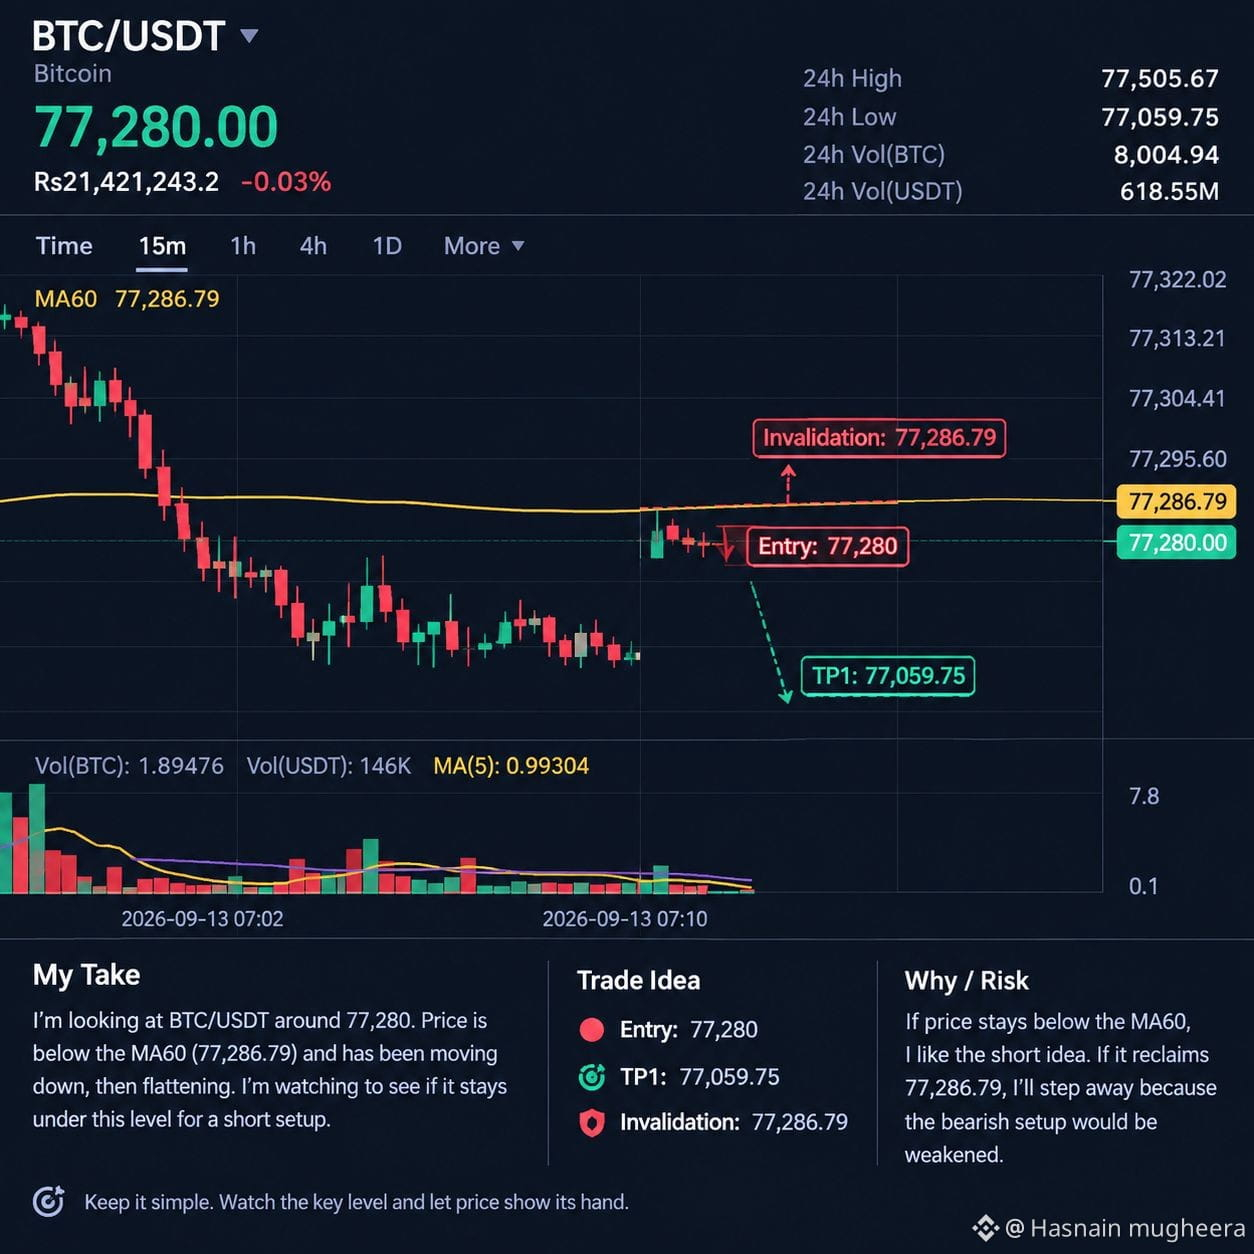
I'm looking at $BTC /USDT sitting around 77,280, with price clearly below the visible MA60 at 77,286.79. The recent move on this chart is downward, followed by a flat pause around 77,280, so I’m not seeing strong confirmation for a reversal yet.
For me, the key level is 77,286.79. If price stays below that moving average, I’d be more interested in a continuation setup rather than chasing a bounce. I’d like to see price remain under this level before considering the idea attractive.
📍 Entry: 77,280 area
🎯 TP1: 77,059.75
🛑 Invalidation: 77,286.79
The main issue is that the screenshot doesn’t give enough clearly readable lower price levels to justify multiple targets, so I’m keeping this setup simple rather than inventing them.
If price reclaims 77,286.79, I’d step away from this short idea because the immediate bearish setup would be weakened. The visible volume is also relatively modest, so I’d want confirmation instead of assuming the move will continue.
For now, I’m watching whether BTC can stay below the MA60 and continue pressing lower.
For me, the key level is 77,286.79. If price stays below that moving average, I’d be more interested in a continuation setup rather than chasing a bounce. I’d like to see price remain under this level before considering the idea attractive.
📍 Entry: 77,280 area
🎯 TP1: 77,059.75
🛑 Invalidation: 77,286.79
The main issue is that the screenshot doesn’t give enough clearly readable lower price levels to justify multiple targets, so I’m keeping this setup simple rather than inventing them.
If price reclaims 77,286.79, I’d step away from this short idea because the immediate bearish setup would be weakened. The visible volume is also relatively modest, so I’d want confirmation instead of assuming the move will continue.
For now, I’m watching whether BTC can stay below the MA60 and continue pressing lower.