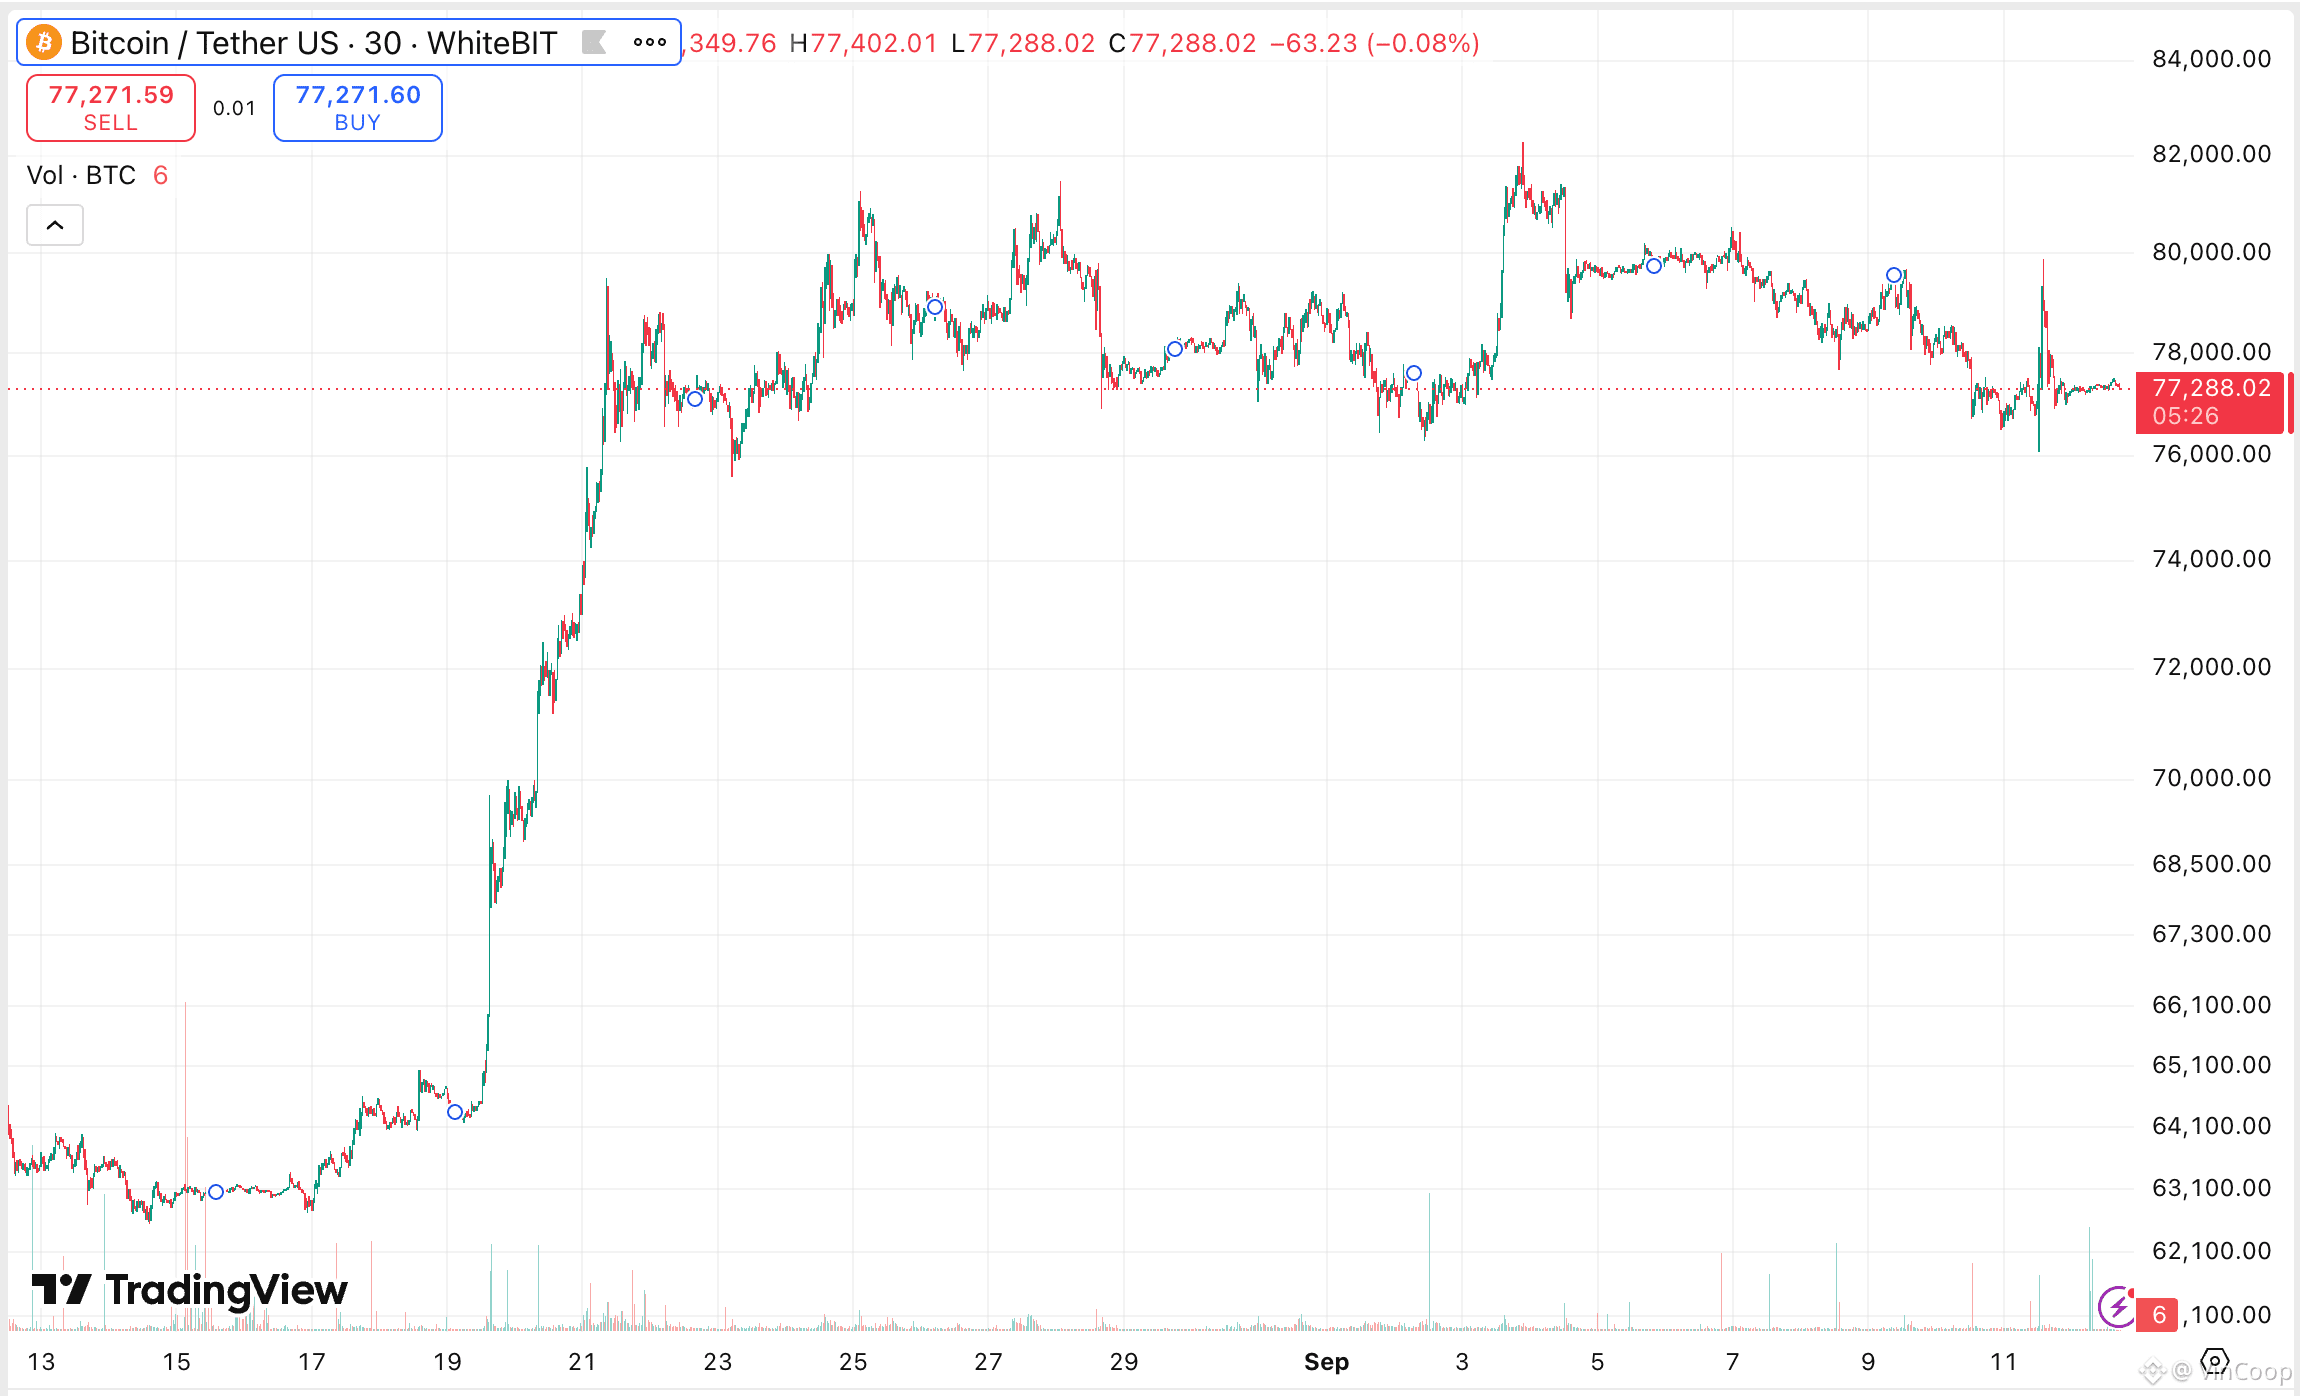
Bitcoin’s 24% Rebound Now Has a Clear Supply Map $BTC has rallied from below $65K to above $82K, but CryptoQuant’s data suggests the recovery now faces a sequence of increasingly difficult supply zones rather than one single breakout level. Upside map $81.7K → 365-day moving average and the first major confirmation level $83.6K → 3x Metcalfe valuation band, which also rejected price in May $88.7K → trader realized-price upper band, where profit-taking has historically intensified The immediate obstacle is even closer. CryptoQuant estimates that roughly 539,000 BTC were sold by long-term holders between $77.1K and $80.2K during the year, creating the heaviest nearby on-chain supply wall. Bitcoin has to absorb that inventory before a move through the higher resistance bands becomes more convincing. The downside map is cleaner: the 200-day moving average near $70K is the first major support, followed by the $62K–$65K zone, where around 476,000 BTC were accumulated. So the current setup is less “bullish or bearish” than a test of absorption. The 24% recovery has already happened; the next phase depends on whether BTC can turn a dense holder-supply zone into support and then clear $81.7K, $83.6K and $88.7K in sequence. #BTC Price Analysis# #Bitcoin Price Prediction: What is Bitcoins next move?# #Ad #Bitcoin

Veröffentlichen

--
Haftungsausschluss: Enthält Meinungen von Drittanbietern. Keine Beratung. Binance AI wird ohne Gewähr bereitgestellt. Siehe AGB.