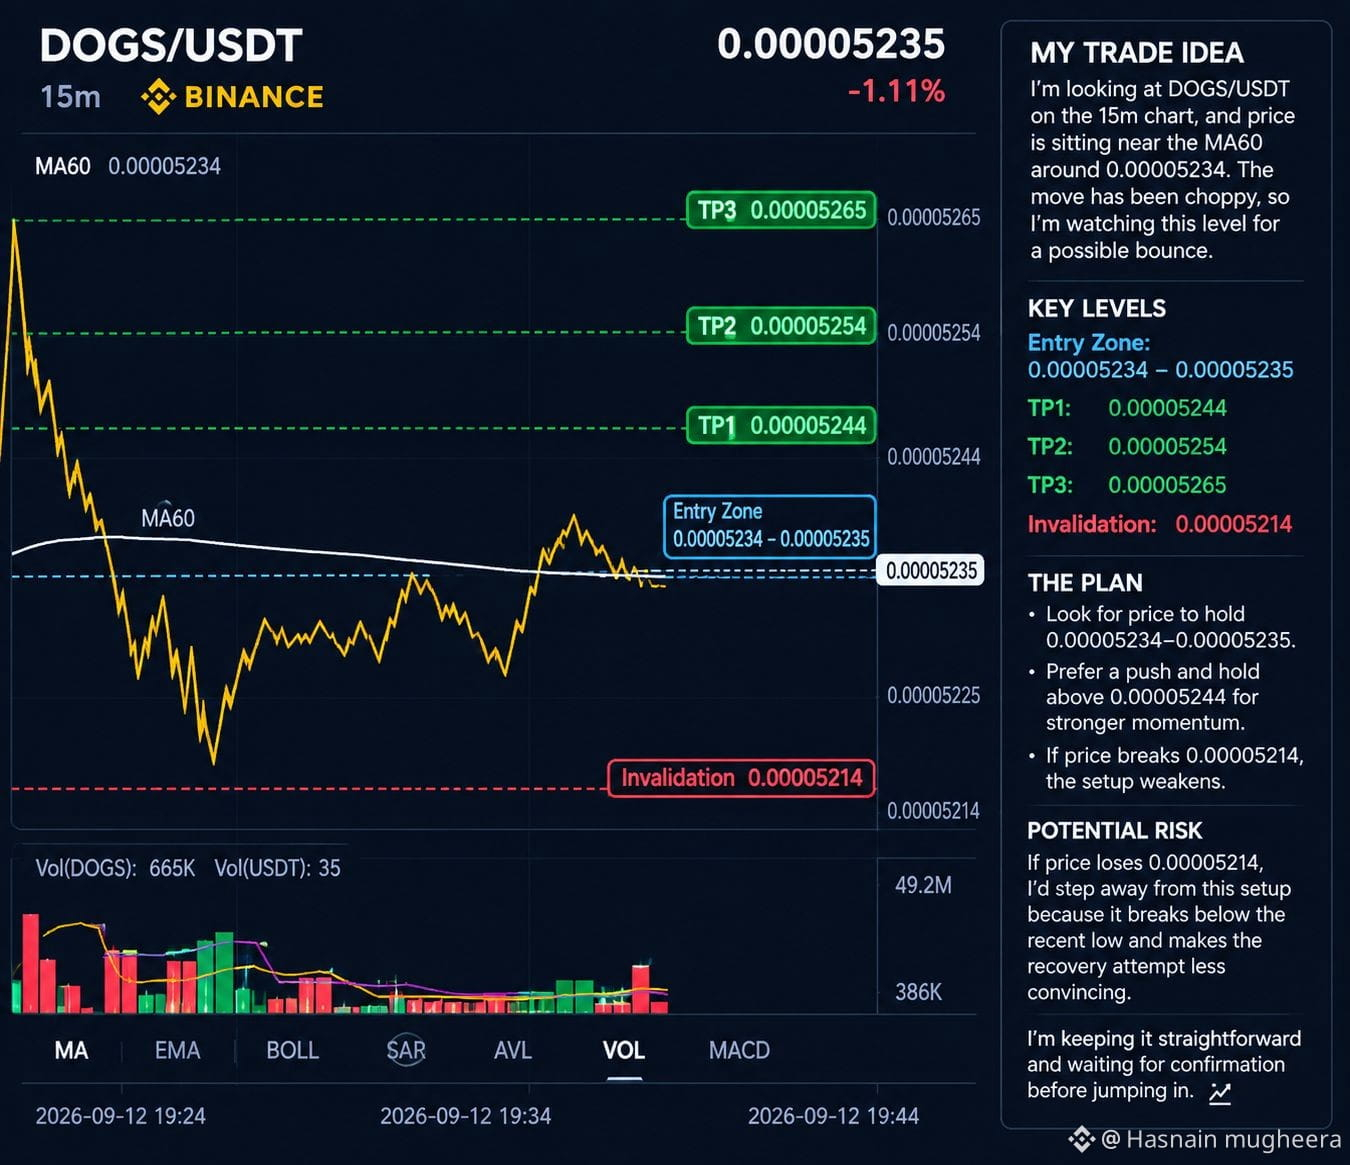
I’m looking at $DOGS /USDT on the 15m chart, and price is sitting almost exactly on the MA60 around 0.00005234, with current price near 0.00005235. The recent move has been choppy, so I’m treating this as a cautious setup rather than a confirmed breakout.
For me, the key area is 0.00005234–0.00005235. Holding this zone would keep the recent recovery structure interesting. I’d like to see price push and hold above 0.00005244 before considering stronger upside momentum.
The visible downside area I’m watching is around 0.00005214, where the recent chart low sits. If price loses that area, the setup would weaken considerably.
📍 Entry: 0.00005234–0.00005235
🎯 TP1: 0.00005244
🎯 TP2: 0.00005254
🎯 TP3: 0.00005265
🛑 Invalidation: 0.00005214
If price loses 0.00005214, I’d step away from this setup because that would break below the visible recent low and make the recovery attempt less convincing.
I’m keeping this one controlled. The chart is still relatively sideways, so I’d rather wait for confirmation than chase a move.
For me, the key area is 0.00005234–0.00005235. Holding this zone would keep the recent recovery structure interesting. I’d like to see price push and hold above 0.00005244 before considering stronger upside momentum.
The visible downside area I’m watching is around 0.00005214, where the recent chart low sits. If price loses that area, the setup would weaken considerably.
📍 Entry: 0.00005234–0.00005235
🎯 TP1: 0.00005244
🎯 TP2: 0.00005254
🎯 TP3: 0.00005265
🛑 Invalidation: 0.00005214
If price loses 0.00005214, I’d step away from this setup because that would break below the visible recent low and make the recovery attempt less convincing.
I’m keeping this one controlled. The chart is still relatively sideways, so I’d rather wait for confirmation than chase a move.