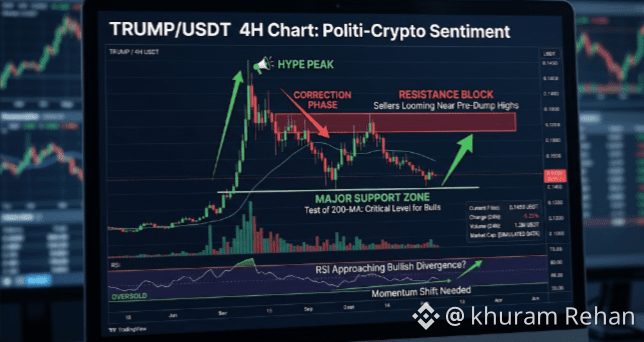
$TRUMP A representative technical chart of TRUMP/USDT reveals the intense volatility of the pair. A sudden, massive vertical spike indicates a period of high-volume, news-driven hype. This is often followed by a rapid, sharp correction as initial buyers take profit or the news cycle changes. Currently, the asset appears to be consolidating near a support level (indicated in green), attempting to find a base after the last major dump. Resistance zones (indicated in red) now sit overhead, marking areas where previous rallies stalled. Volume confirms the high activity during these spikes. Traders often watch for breaks of key consolidation levels to predict the next trend.
#EtherRalliesAsBearishBetsLiquidate #USInflationHoldsAt3.4%InAugust
#EtherRalliesAsBearishBetsLiquidate #USInflationHoldsAt3.4%InAugust