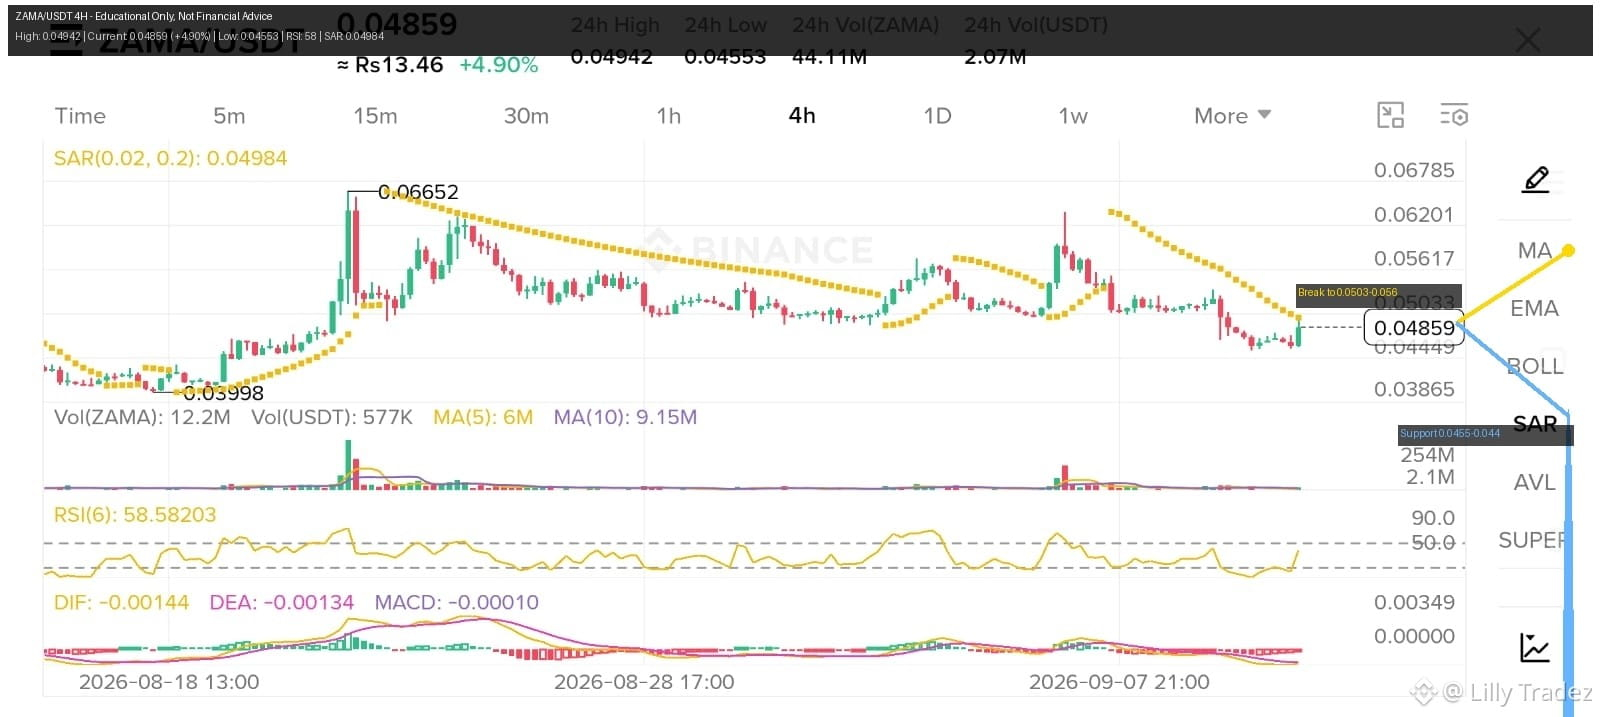
📊 $ZAMA MA/USDT 4H Chart Analysis: What’s Next for ZAMA? 📊
Looking at the 4-hour timeframe, $ZAMA is showing signs of potential trend continuation after rebounding off the $0.03998 low.
🔍 Key Observations:
Resistance & Breakout Point: The price is hovering right near the major trendline resistance around $0.05033. A breakout here opens the path toward upper targets at $0.05617 and $0.06785.
Support Base: Strong support holds firm between $0.04553 and $0.04400.
RSI Indicator: Currently sitting at 58.58, showing healthy buying interest without being overbought.
Moving Averages & SAR: Moving averages are flattening, signaling momentum shift from consolidation to potential upward expansion.
⚠️ Key Takeaway: Wait for a 4H candle closure above $0.05033 for higher probability entries. Manage your position sizing carefully!
What’s your price prediction for $ZAMA this week? Bullish or Bearish? 💬💬
Looking at the 4-hour timeframe, $ZAMA is showing signs of potential trend continuation after rebounding off the $0.03998 low.
🔍 Key Observations:
Resistance & Breakout Point: The price is hovering right near the major trendline resistance around $0.05033. A breakout here opens the path toward upper targets at $0.05617 and $0.06785.
Support Base: Strong support holds firm between $0.04553 and $0.04400.
RSI Indicator: Currently sitting at 58.58, showing healthy buying interest without being overbought.
Moving Averages & SAR: Moving averages are flattening, signaling momentum shift from consolidation to potential upward expansion.
⚠️ Key Takeaway: Wait for a 4H candle closure above $0.05033 for higher probability entries. Manage your position sizing carefully!
What’s your price prediction for $ZAMA this week? Bullish or Bearish? 💬💬