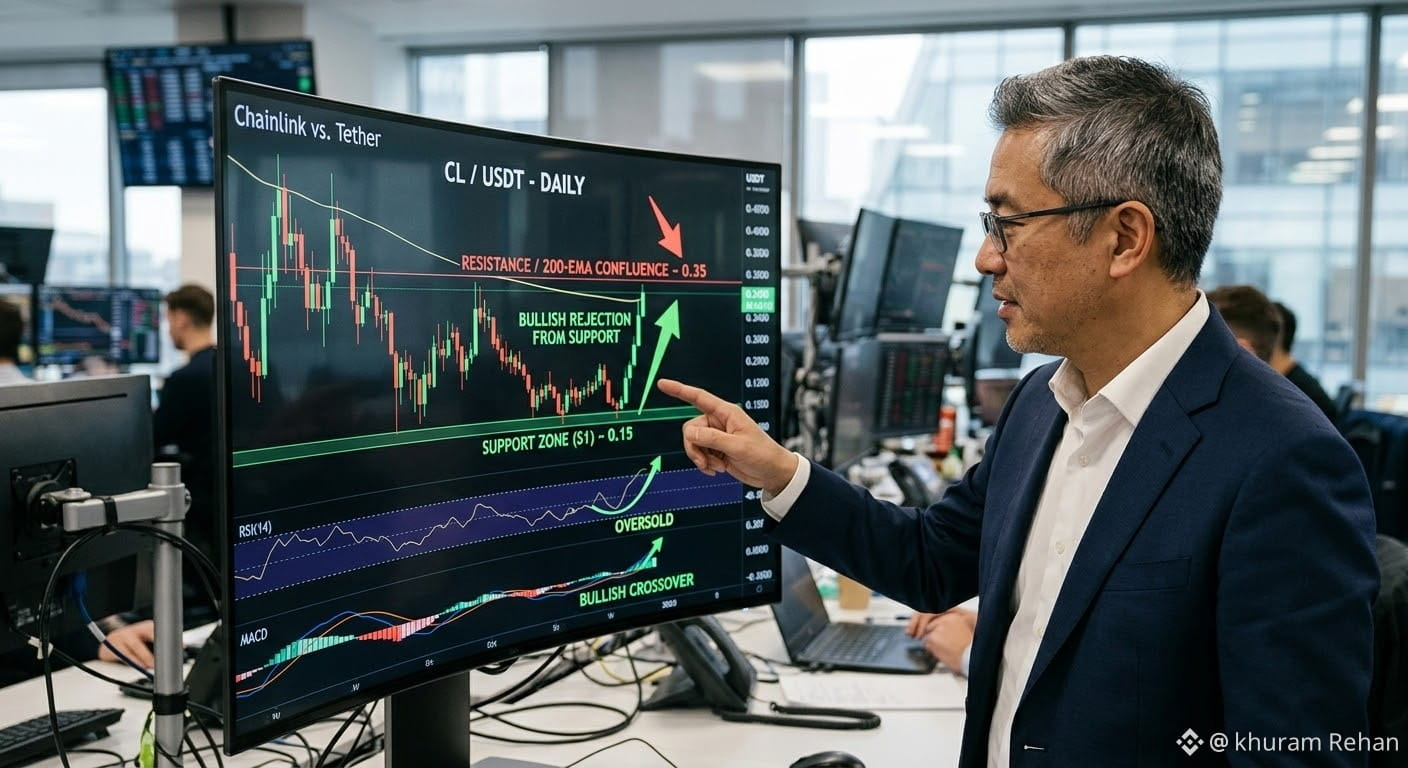
$CL The CL/USDT pair has exhibited notable volatility in the recent trading period, reflecting sharp changes in market sentiment and underlying commodity drivers. Following a sustained downtrend characterized by consecutive red weekly and daily candles, the asset reached a major technical support zone (S1) near the $0.15 mark. This area, which historically marked a critical turning point and accumulation zone, proved robust once again.
In the subsequent period, the chart reveals a dramatic high-volume rejection from this support. This suggests that the low price levels attracted significant institutional interest or algorithmic buying, triggering an impulse move upward. The resulting "long-legged Doji" candlestick formation (seen on daily/weekly charts) is a textbook indicator of trend reversal or strong indecision at extremes, paving the way for the substantial bullish recovery shown.
Currently, the price has surged and is testing a key resistance confluence. This area, around $0.35-$0.38, aligns with both the 200-day exponential moving average (200-EMA)—a long-term trend indicator—and the previous high-volume breakdown point (Resistance Zone R1). While the recent momentum is strongly bullish, traders will be closely watching for a breakout and daily close above this 200-EMA to confirm a fundamental shift back to a long-term uptrend. If momentum stalls, a retest of intermediate support near $0.28 (50-EMA) is possible before the next decisive move
#CryptoSectorsFallSecondDay #CPIWatch #CLARITYActRevisionToRuleNonDeFiControllers
In the subsequent period, the chart reveals a dramatic high-volume rejection from this support. This suggests that the low price levels attracted significant institutional interest or algorithmic buying, triggering an impulse move upward. The resulting "long-legged Doji" candlestick formation (seen on daily/weekly charts) is a textbook indicator of trend reversal or strong indecision at extremes, paving the way for the substantial bullish recovery shown.
Currently, the price has surged and is testing a key resistance confluence. This area, around $0.35-$0.38, aligns with both the 200-day exponential moving average (200-EMA)—a long-term trend indicator—and the previous high-volume breakdown point (Resistance Zone R1). While the recent momentum is strongly bullish, traders will be closely watching for a breakout and daily close above this 200-EMA to confirm a fundamental shift back to a long-term uptrend. If momentum stalls, a retest of intermediate support near $0.28 (50-EMA) is possible before the next decisive move
#CryptoSectorsFallSecondDay #CPIWatch #CLARITYActRevisionToRuleNonDeFiControllers