
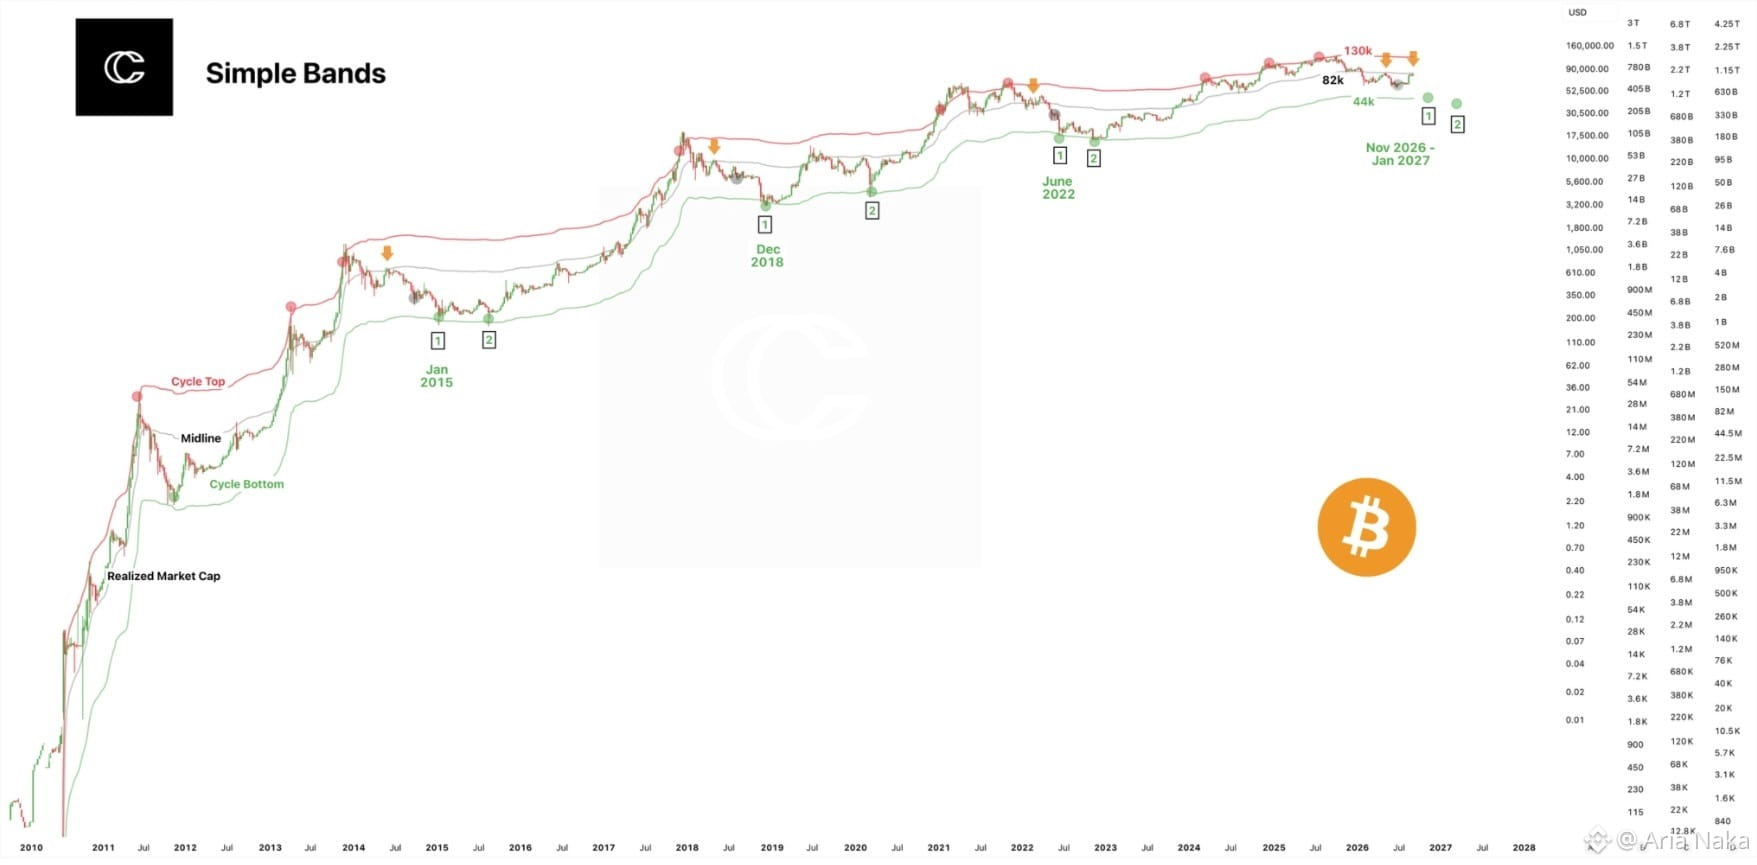
$BTC Is Entering The Zone Where Cycle History Gets Dangerous The Simple Bands framework is flashing a critical signal for $BTC. Across previous market cycles, Bitcoin repeatedly pushed toward the upper red Cycle Top band before major exhaustion, while the green lower band marked deep structural resets. The current structure is once again compressing toward the upper boundary, suggesting the market is approaching a historically important decision zone. The chart places the projected Cycle Top around $130K, with the current midline near $82K and the lower structural band around $44K. That spread is important because it shows how much volatility can exist even inside a long term bullish cycle. A rejection from the upper band would not automatically mean a bear market, but it could trigger a much deeper mean reversion toward the midline. Historically, Bitcoin did not need to break the Cycle Top band by a huge margin to signal exhaustion. The 2013, 2017 and 2021 peaks all developed near the upper boundary before entering major corrections. The key technical signal now is whether $BTC can continue expanding above the midline while keeping the upper band rising, or whether price begins losing momentum as the band flattens. The most aggressive part of the chart is the Nov 2026 to Jan 2027 projection, where the bands suggest a potential final expansion toward $130K. If BTC reaches that region while the Cycle Top band remains intact, historical structure would argue for extreme caution rather than blind FOMO. $82K becomes the critical equilibrium zone, while $130K represents the historical exhaustion zone. #BTC Price Analysis# #Macro Insights#

Veröffentlichen
Haftungsausschluss: Enthält Meinungen von Drittanbietern. Keine Beratung. Binance AI wird ohne Gewähr bereitgestellt. Siehe AGB.