$TRB
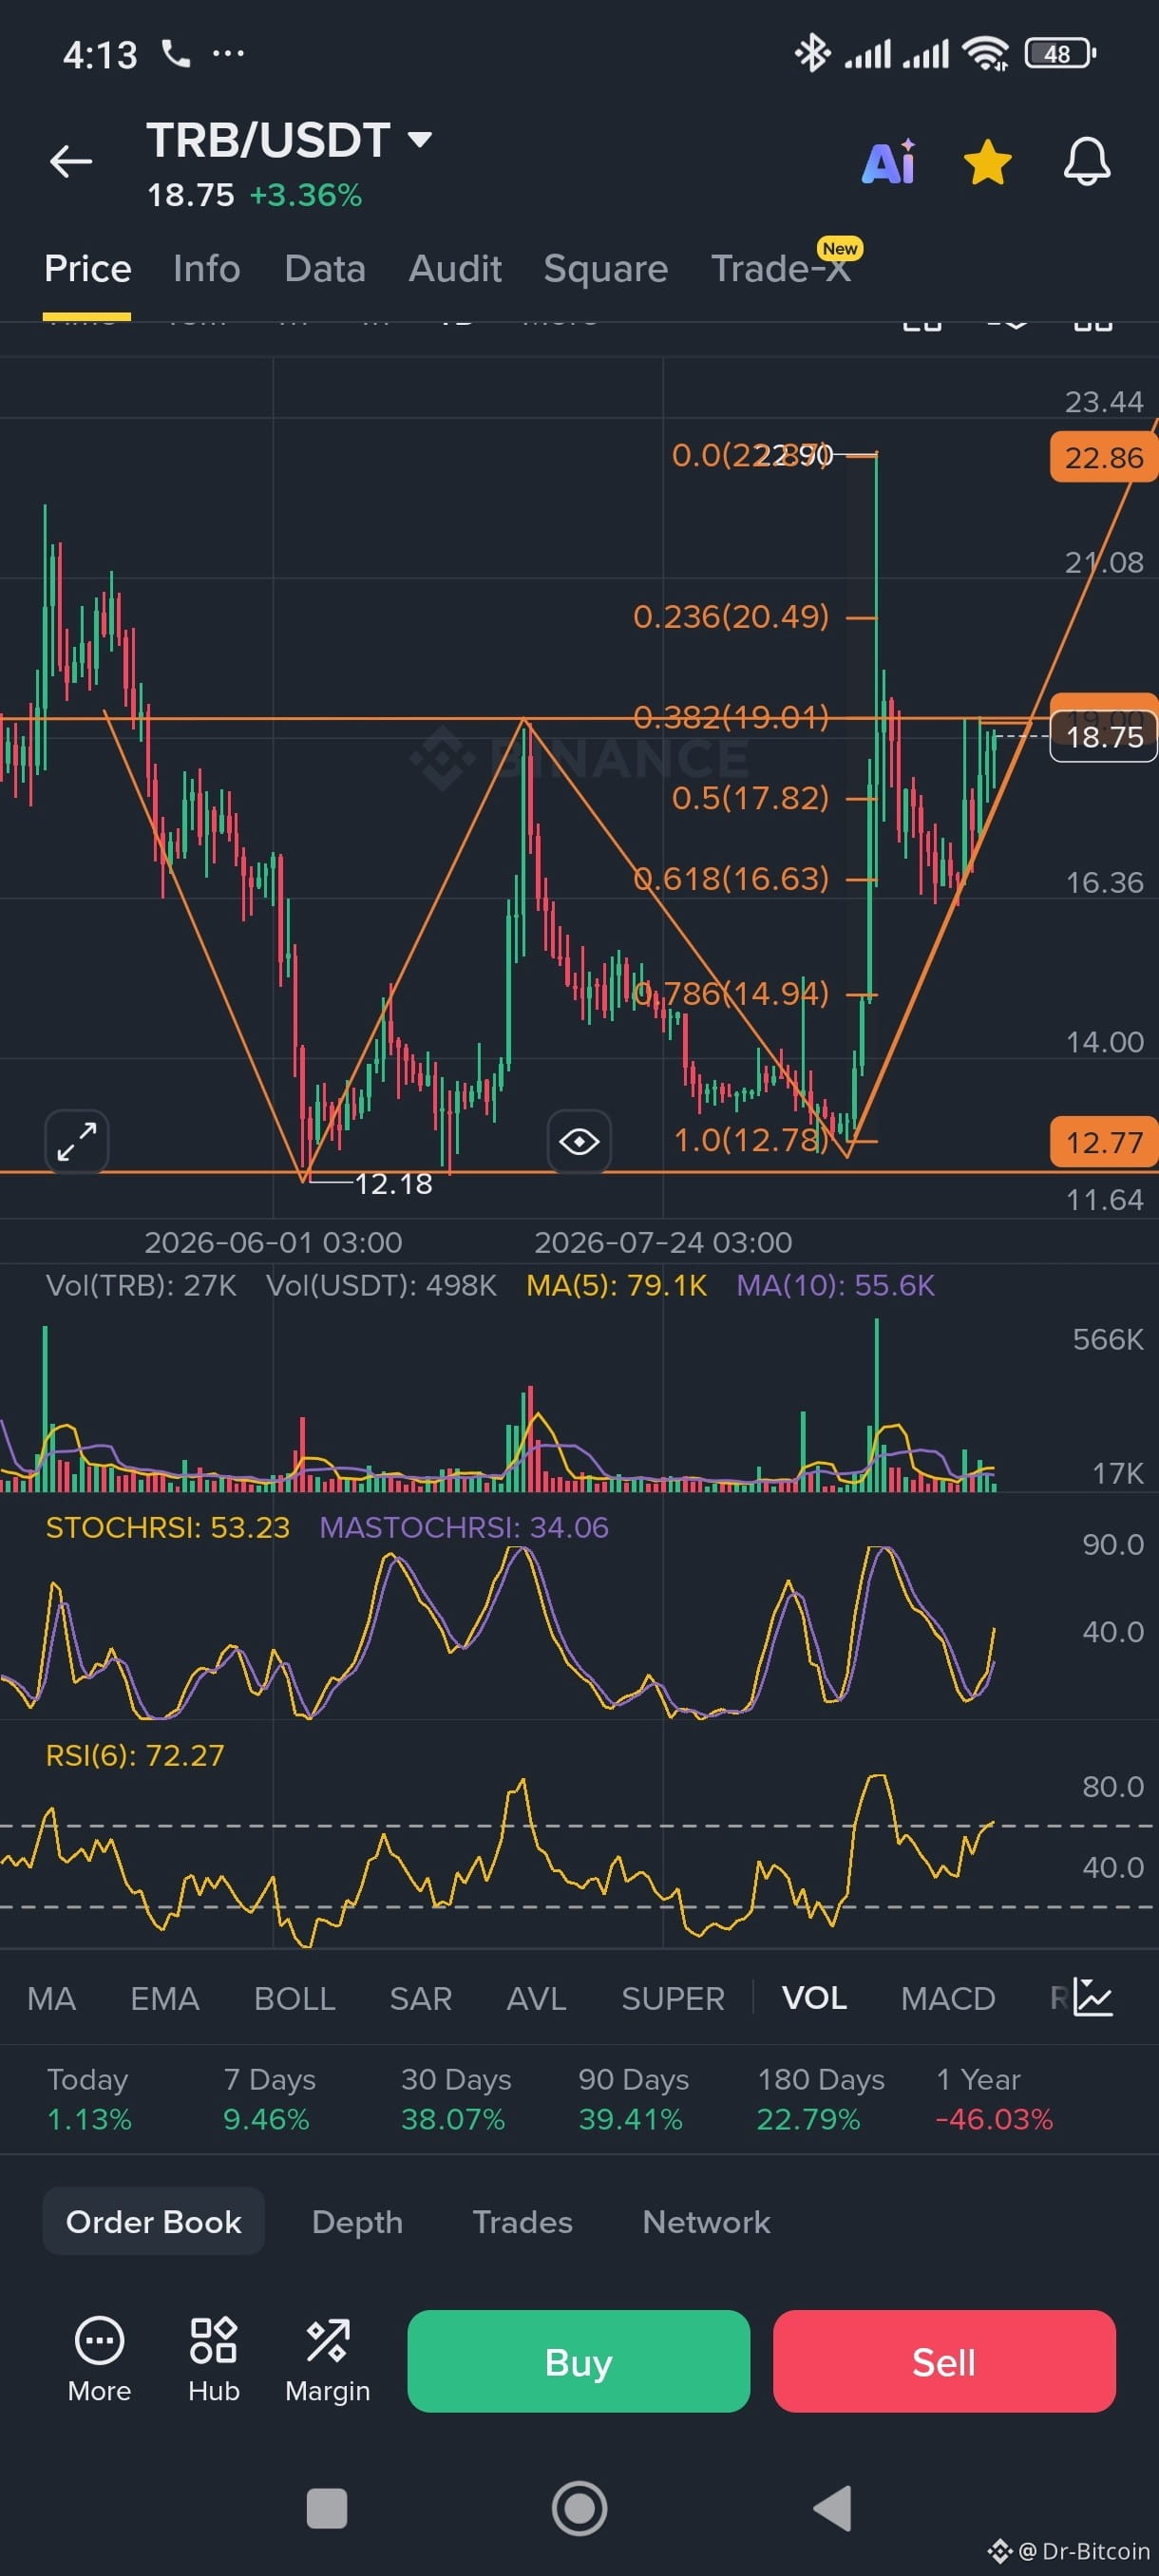
#TRB/USDT W Pattern Analysis:*
1. *Pattern*: The chart is forming a clear *W-shaped bottom* with lows at $12.18 and $12.77, and a middle peak at $19.01.
2. *Neckline*: The key neckline resistance sits at *$19.01* — the 0.382 Fib level. Price is currently testing it at $18.75.
3. *Confirmation*: A daily close above $19.01 with strong volume confirms the W pattern breakout.
4. *Target 1*: Measured move from the bottom to the neckline is ∼$6.24. Adding it to the neckline gives a target of *$25.25*.
5. *Mid Targets*: Before $25, TRB will face resistance at $20.49 and then the previous high at $22.86.
6. *Indicators*: RSI(6) at 72.27 shows overbought, but price above MA5 and MA10 with rising volume supports bulls.
7. *Invalidation*: If it fails to break $19.01 and drops below $17.82, the W pattern fails and we retest $16.63.
*Bottom line*: Break and hold above $19.01 = next stop $25.
Reject at $19.01 = pullback to trendline support.
#TRB/USDT W Pattern Analysis:*
1. *Pattern*: The chart is forming a clear *W-shaped bottom* with lows at $12.18 and $12.77, and a middle peak at $19.01.
2. *Neckline*: The key neckline resistance sits at *$19.01* — the 0.382 Fib level. Price is currently testing it at $18.75.
3. *Confirmation*: A daily close above $19.01 with strong volume confirms the W pattern breakout.
4. *Target 1*: Measured move from the bottom to the neckline is ∼$6.24. Adding it to the neckline gives a target of *$25.25*.
5. *Mid Targets*: Before $25, TRB will face resistance at $20.49 and then the previous high at $22.86.
6. *Indicators*: RSI(6) at 72.27 shows overbought, but price above MA5 and MA10 with rising volume supports bulls.
7. *Invalidation*: If it fails to break $19.01 and drops below $17.82, the W pattern fails and we retest $16.63.
*Bottom line*: Break and hold above $19.01 = next stop $25.
Reject at $19.01 = pullback to trendline support.