🚀 $SEI / USDT Analysis: Bulls Eyeing Breakout Above Resistance! 📈
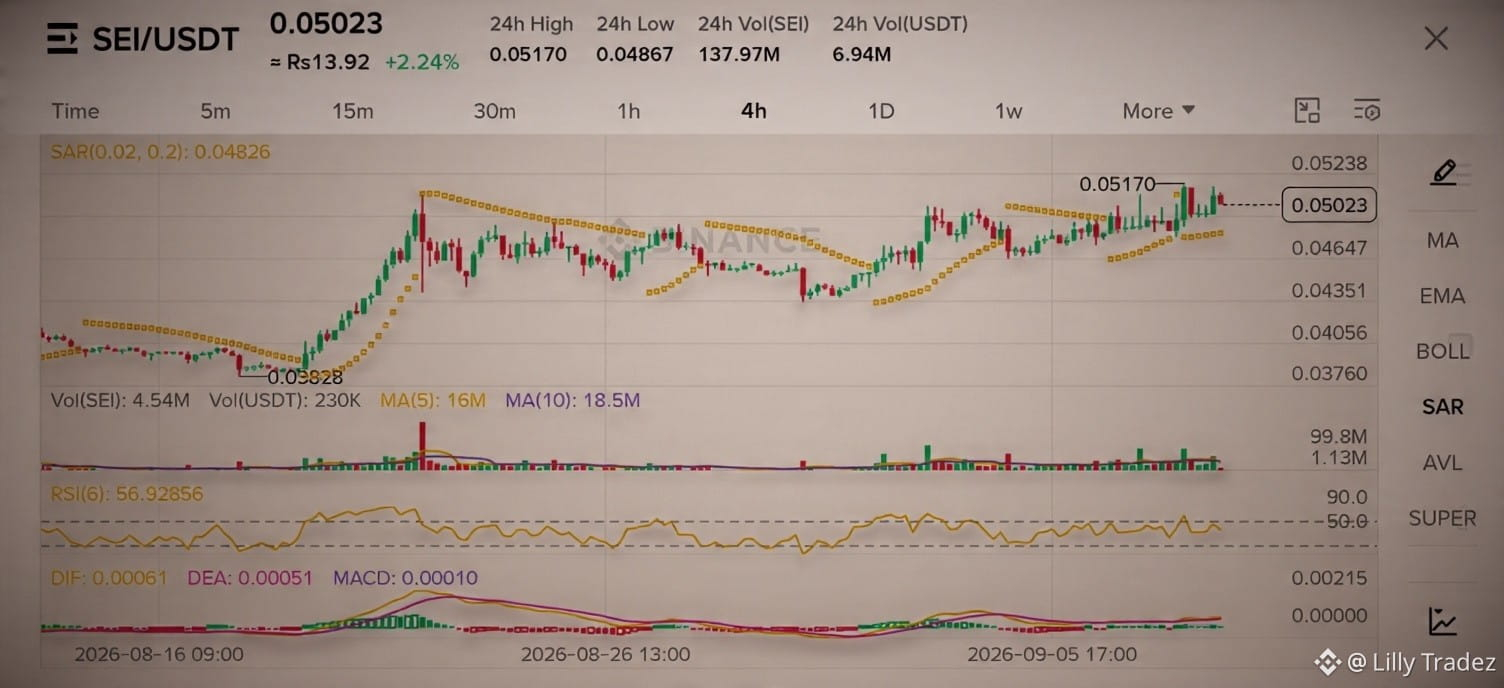
The 4-hour chart for $SEI shows strong consolidation near the local resistance zone!
🔍 Key Observations:
Current Price: $0.05023 (+2.24%)
RSI (6): 56.92 – Healthy bullish momentum without being overbought.
Parabolic SAR: Dots shifted below the price candles, signaling an ongoing upward trend.
MACD: Golden cross intact above the zero line with green histogram bars forming.
💡 Trade Setup:
Entry Zone: $0.04880 – $0.05000
Target 1: $0.05170 (Recent High)
Target 2: $0.05350
Stop Loss: $0.04640 (Below immediate support)
Risk management is essential! Always trade with a tight stop loss. What is your price target for $SEI? Let us know in the comments below! 👇
The 4-hour chart for $SEI shows strong consolidation near the local resistance zone!
🔍 Key Observations:
Current Price: $0.05023 (+2.24%)
RSI (6): 56.92 – Healthy bullish momentum without being overbought.
Parabolic SAR: Dots shifted below the price candles, signaling an ongoing upward trend.
MACD: Golden cross intact above the zero line with green histogram bars forming.
💡 Trade Setup:
Entry Zone: $0.04880 – $0.05000
Target 1: $0.05170 (Recent High)
Target 2: $0.05350
Stop Loss: $0.04640 (Below immediate support)
Risk management is essential! Always trade with a tight stop loss. What is your price target for $SEI? Let us know in the comments below! 👇