🔥 RSI DOESN’T TELL YOU TO SELL — HERE’S WHAT IT ACTUALLY MEANS
RSI above 70 does NOT automatically mean sell. 🚨
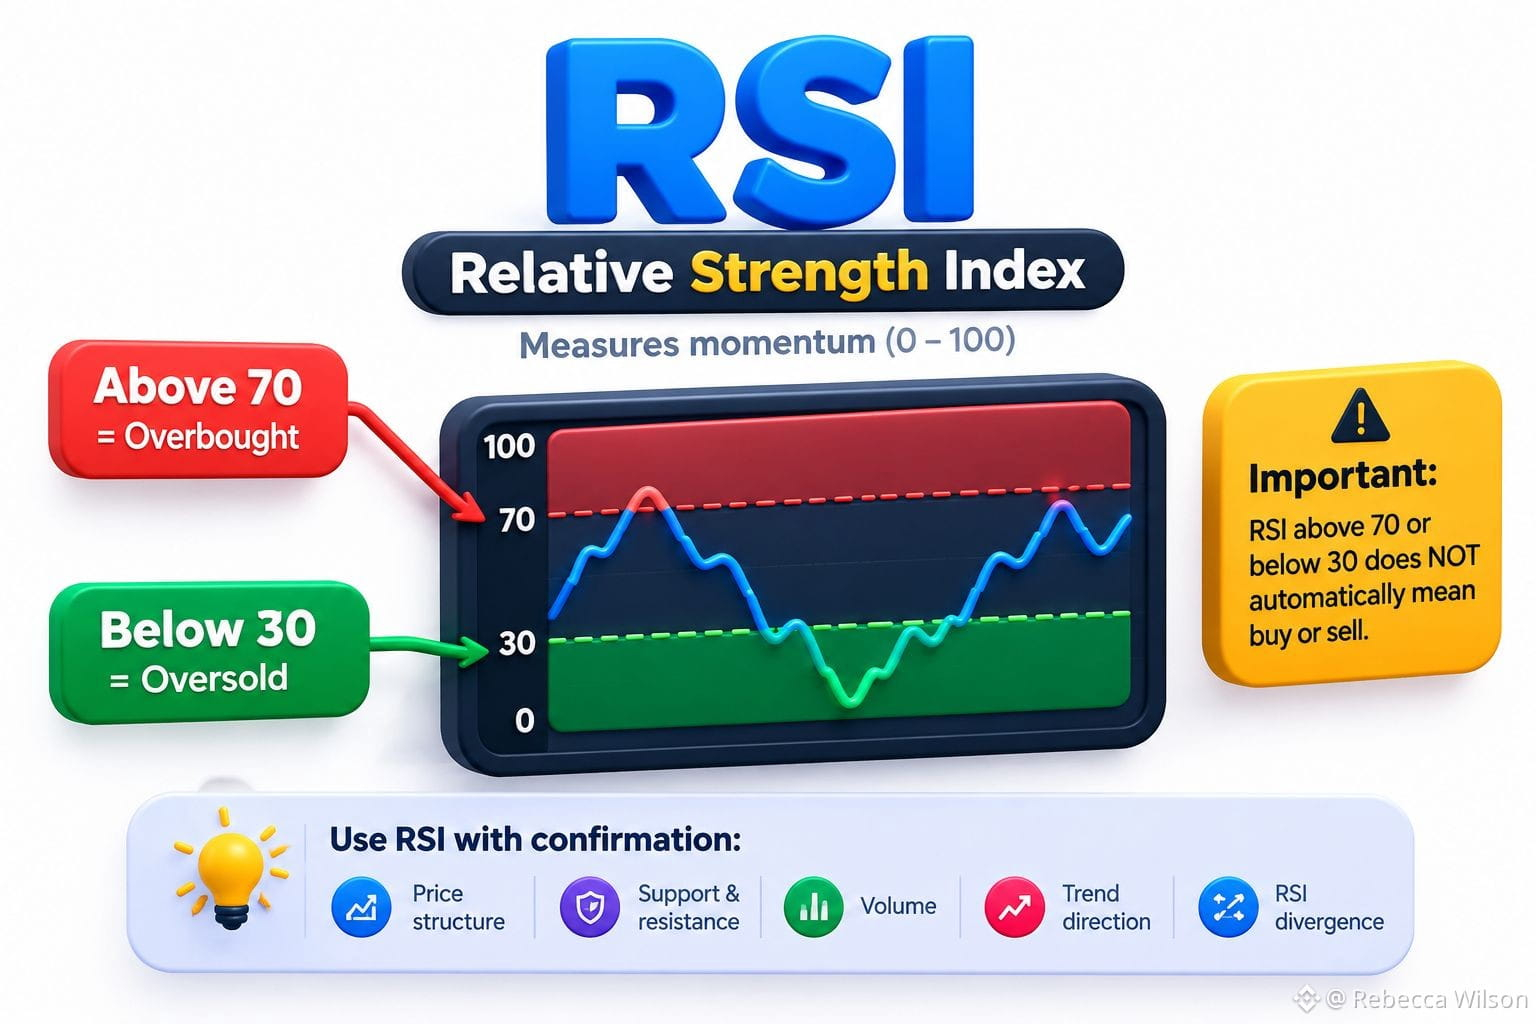
The Relative Strength Index (RSI) measures momentum on a scale from 0–100.
📈 Above 70: Traditionally considered “overbought”
📉 Below 30: Traditionally considered “oversold”
⚠️ But here’s the trap: strong trends can keep RSI above 70 or below 30 for a long time.
That’s why RSI should be confirmation—not a standalone buy/sell signal.
Look for confirmation from:
• Price structure
• Support & resistance
• Volume
• Trend direction
• RSI divergence
$FF $IOST $ATOM
🎯 The real question isn’t “Is RSI above 70?” — it’s “What is price doing while RSI is above 70?”
💬 COMMENT “RSI” if you want the next post: RSI Divergence Explained.
RSI above 70 does NOT automatically mean sell. 🚨
The Relative Strength Index (RSI) measures momentum on a scale from 0–100.
📈 Above 70: Traditionally considered “overbought”
📉 Below 30: Traditionally considered “oversold”
⚠️ But here’s the trap: strong trends can keep RSI above 70 or below 30 for a long time.
That’s why RSI should be confirmation—not a standalone buy/sell signal.
Look for confirmation from:
• Price structure
• Support & resistance
• Volume
• Trend direction
• RSI divergence
$FF $IOST $ATOM
🎯 The real question isn’t “Is RSI above 70?” — it’s “What is price doing while RSI is above 70?”
💬 COMMENT “RSI” if you want the next post: RSI Divergence Explained.