
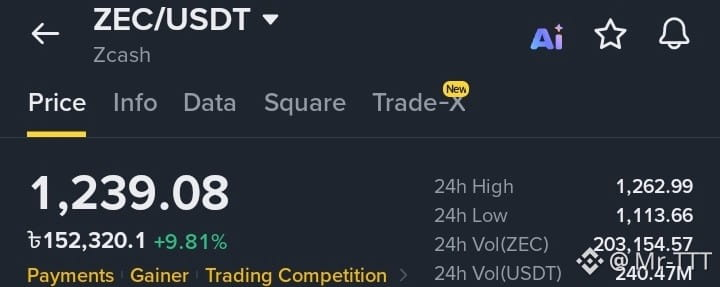

$ZEC The ZEC/USDT trading pair is currently exhibiting a strong parabolic breakout and is trading at approximately $1,239.08, marking a rise of over 9.8% in the last 24 hours. Price action indicates a robust bullish trend; however, multi-timeframe analysis reveals that after touching a recent local peak of $1,262.99, the market is approaching a critical pivot point.
Market Depth and Order Book Imbalance
Dominance of the 'Buy Wall': The market depth chart reveals a significant bullish imbalance, with 'bids' (buy orders) accounting for 84.01% of the total order book volume, while 'asks' (sell orders) make up only 15.99%.
Liquidity Support: This high concentration of bids has established a strong structural price floor. A substantial volume of 'buy limit orders' is positioned to absorb potential selling pressure, effectively limiting the risk of an immediate price drop.
Technical Indicator Analysis
1-Day (Macro Trend): The daily chart shows a vertical price expansion. The RSI(6) indicator stands at 79.98, signaling an 'overbought' condition, while the MACD (DIF: 151.88, DEA: 120.61) displays a significant positive separation. While this confirms immense buying momentum, from a mathematical perspective, it also suggests the need for a 'cooling-off period' or a phase of temporary stabilization. 4-Hour (Medium-term): A market consolidation phase has begun. Although the RSI remains high at 73.52, the MACD histogram has turned slightly negative (MACD: -4.13); this indicates a slowdown in medium-term momentum as traders lock in profits just below the $1,260 resistance level.
1-Hour & 15-Minute (Micro-trend): Short-term momentum is attempting to stabilize. The 1-hour MACD is positive (6.75), and 15-minute price action is hugging the 'Upper Bollinger Band,' with the $1,230 zone acting as a new local support level. The 'SuperTrend' indicator is flashing a strong green (positive) signal.
Key Levels and Forecasts
Immediate Resistance: $1,262.99 (24-hour high). Breaking this ceiling requires a price increase of $23.91 (+1.93%).
Primary Support: $1,170.32 (Middle Bollinger Band on the 4-hour chart).
Macro Support Floor: $1,113.66 (24-hour low). A drop to this level would represent a 10.1% decline from the current trading price.
Driven by massive spot market demand and a robust order book, the current market trend is clearly bullish. However, the RSI indicator on both the 1-day and 4-hour charts signals 'overbought' conditions; consequently, opening new 'long positions' at the current $1,239 level carries a high risk of a price retracement. Before any further attempts at price discovery, the asset is most likely to maintain a stable or sideways consolidation pattern in the short term, trading between the $1,170 support and the $1,260 resistance levels.