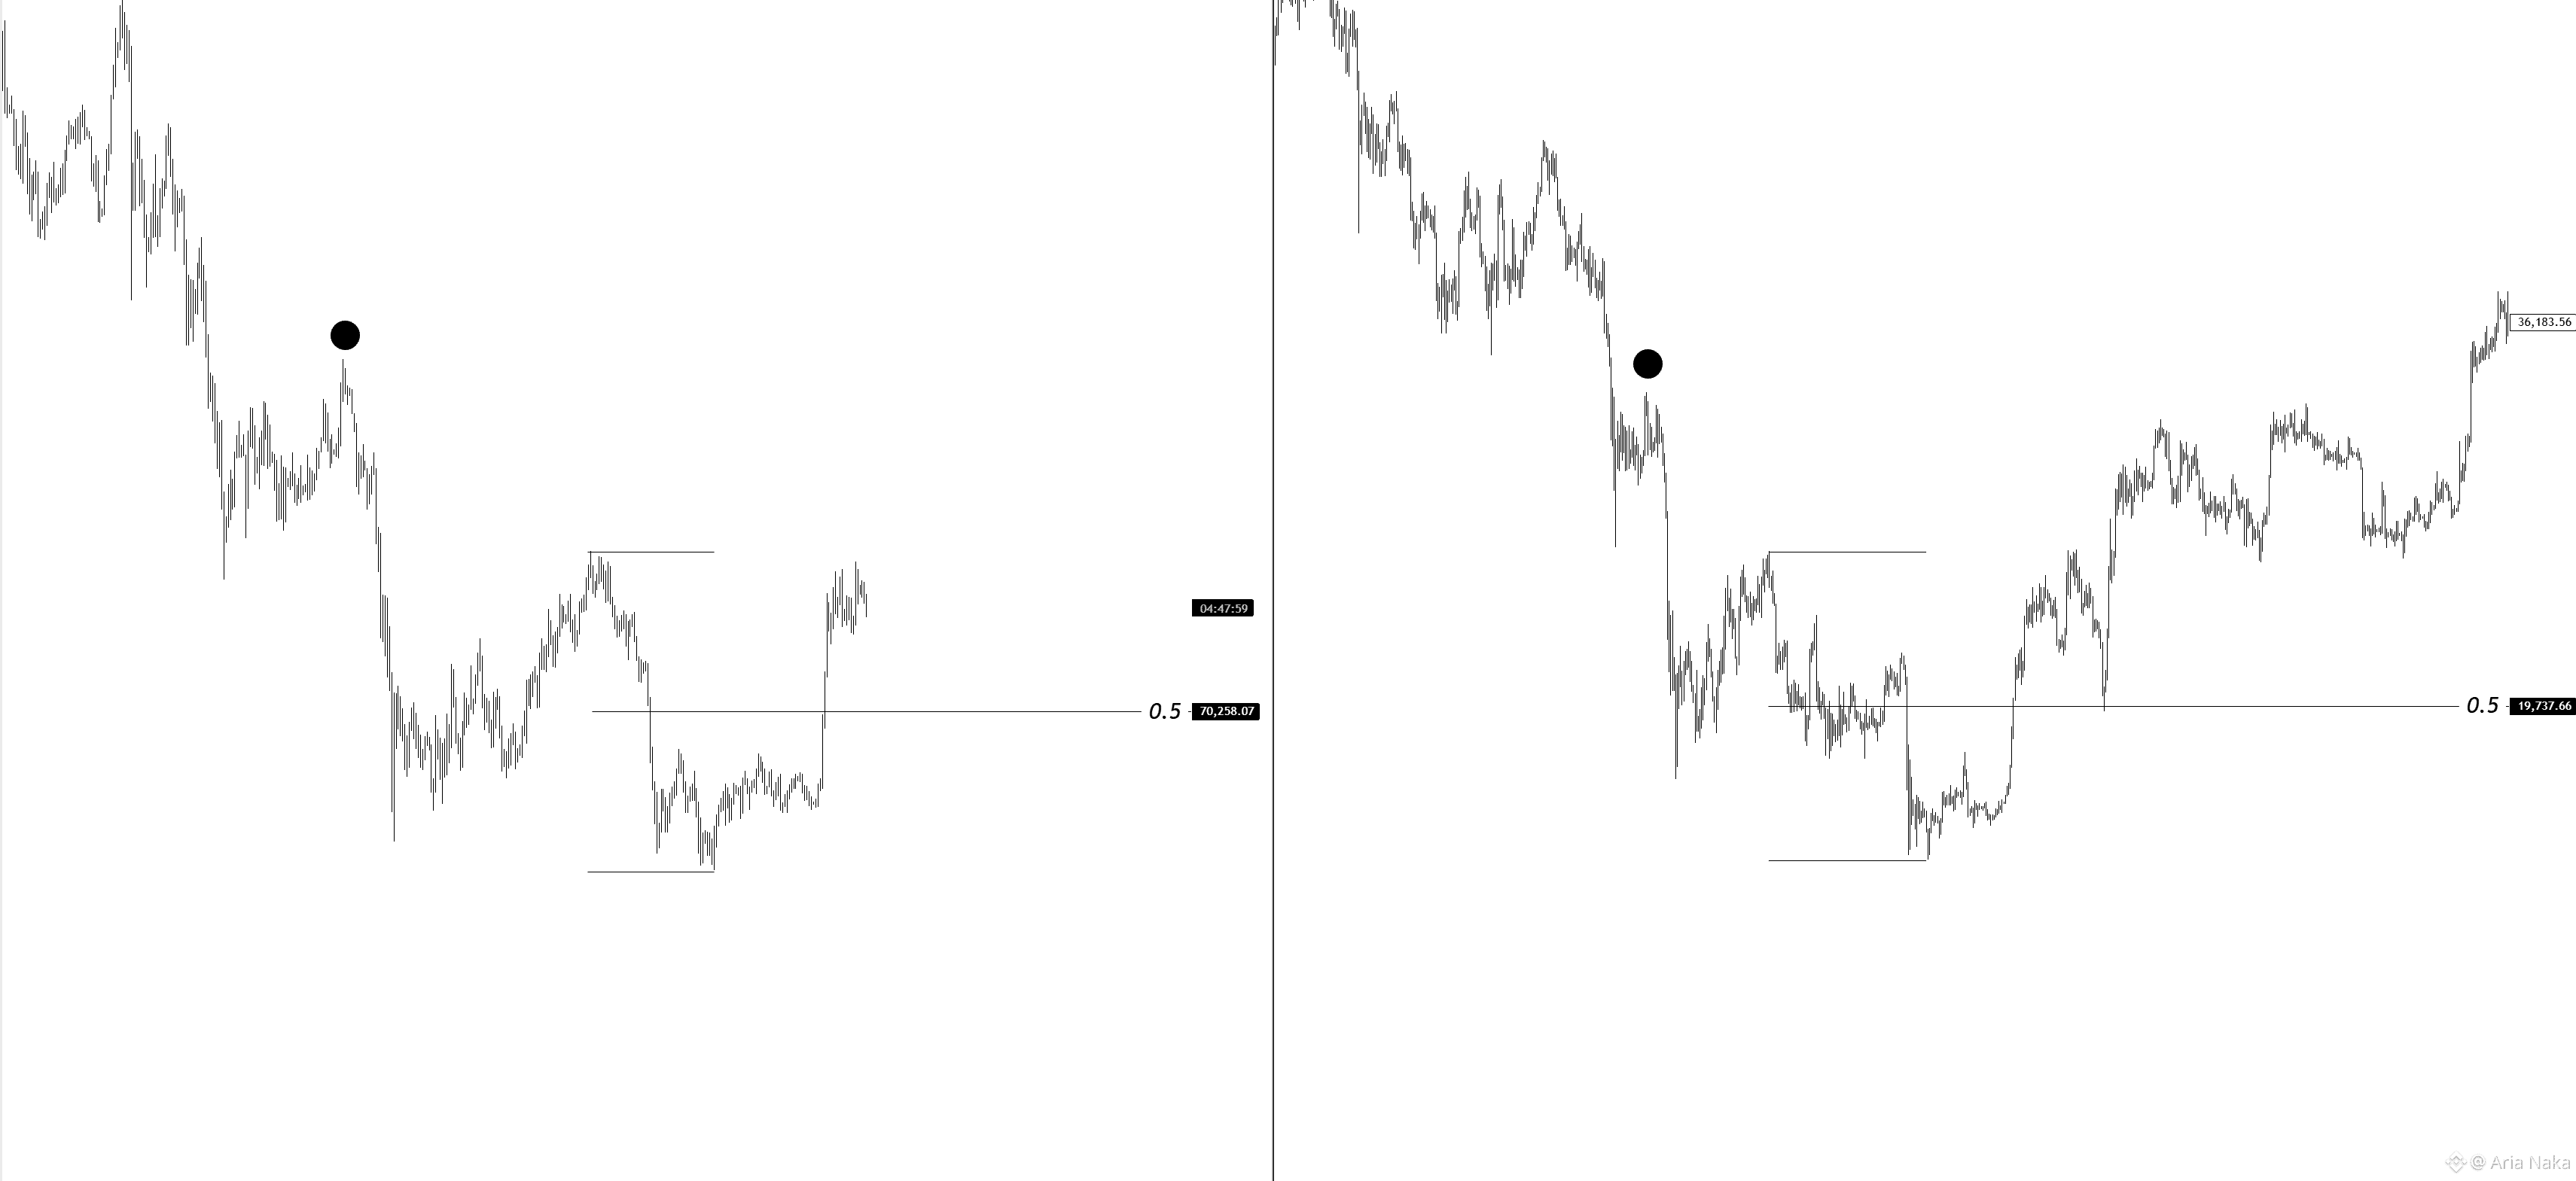
Little pattern I have spotted.
Back in 2022, afte $BTC broke out of its range, price came back down to test the 0.5 level between the range high & range low before continuing higher.
If we happen to follow a similar pattern, it would put a potential higher low around 70K.
Of course, as I have already mentioned, I will be looking for continuation longs around 73-74K, with my invalidation remaining below the 57K low.
Just thought I would showcase this fractal, as it is definitely something I wouldn't be surprised to see play out.
And if it does happen, best believe a lot of people will turn bearish yet again right at the higher low. #BTC Price Analysis# #Macro Insights#
Back in 2022, afte $BTC broke out of its range, price came back down to test the 0.5 level between the range high & range low before continuing higher.
If we happen to follow a similar pattern, it would put a potential higher low around 70K.
Of course, as I have already mentioned, I will be looking for continuation longs around 73-74K, with my invalidation remaining below the 57K low.
Just thought I would showcase this fractal, as it is definitely something I wouldn't be surprised to see play out.
And if it does happen, best believe a lot of people will turn bearish yet again right at the higher low. #BTC Price Analysis# #Macro Insights#