#cryptotradingpro #BTC
🚀 Analysis of $BTC /USD (4H): where next after the withdrawal of liquidity?
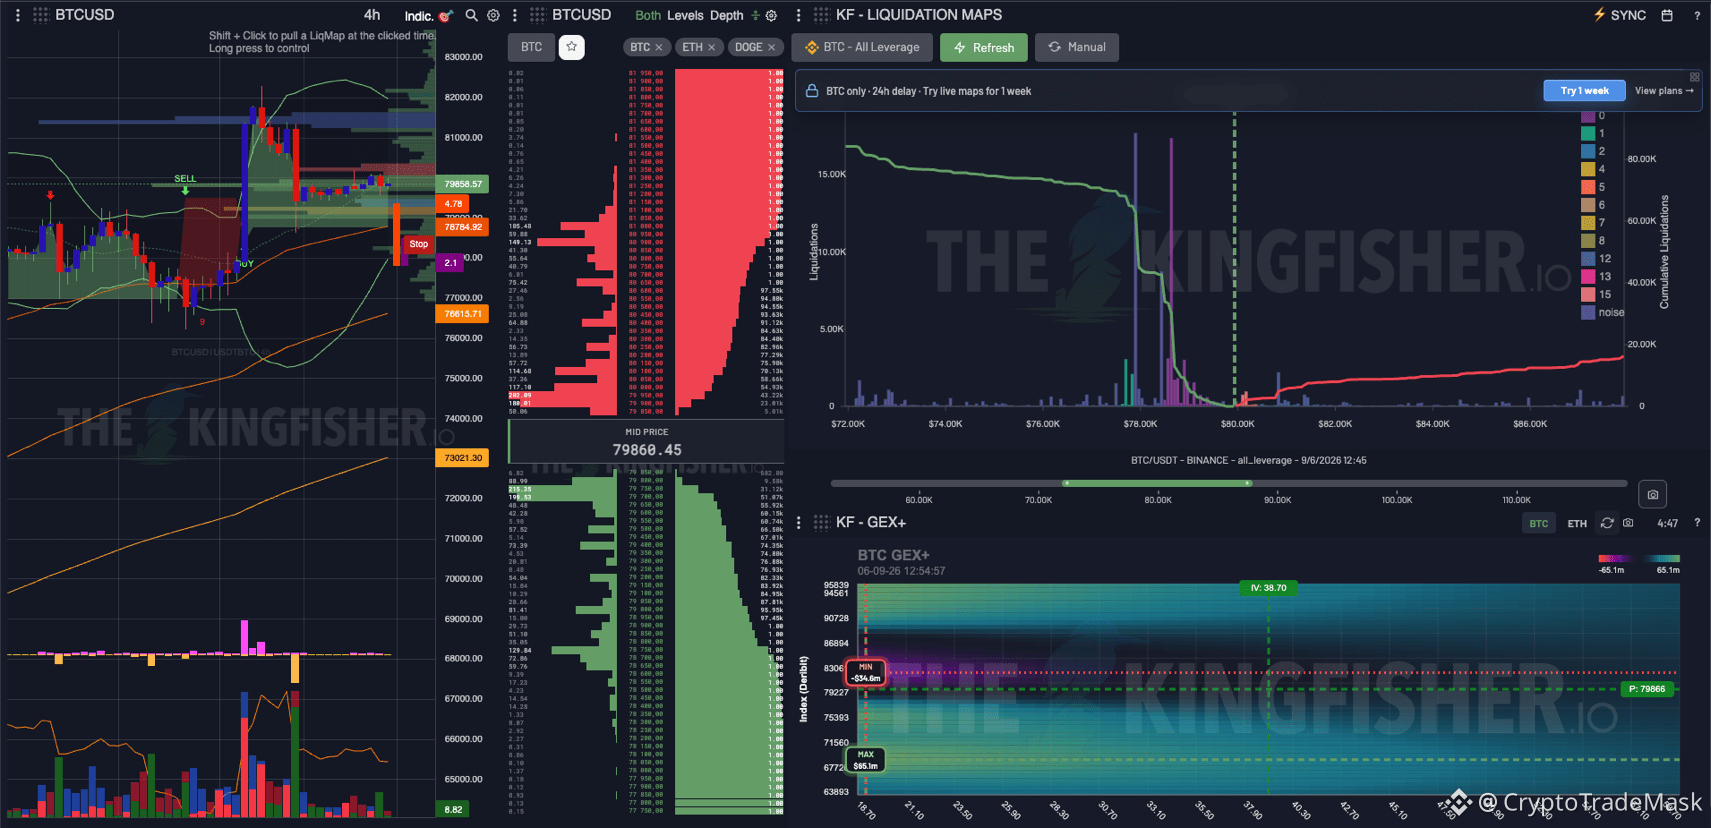
The Bitcoin chart has undergone a predicted local correction after an impulse jump to $82,000+. The current price is trading around $79,860, and the data clearly shows what exactly happened in the market.
🔍 Key factors from charts and metrics
➡️ Liquidation Map: A powerful wave of liquidations of long positions with high leverage took place in the $78,000–$79,000 area. The market unloaded the cabins before the next choice of direction.
➡️ Order glass and volumes: Above the current price ($81,000–$83,000), a dense wall of Sell limits remains, which restrains a quick rebound. At the same time, good buying support has formed in the $76,000–$78,000 area.
➡️ Gamma Zones (GEX+): The lower threshold of the risk corridor is shifted to $75,300–$78,200. As long as the price is above this range, the global pattern remains constructive.
📊 Levels to watch
Resistance: $81,000–$82,500 (short liquidity accumulation and sales zones).
Support 1: $78,500–$78,700 (local bottom after the last drain).
Support 2 (key): $76,600–$77,000 (dynamic trendline).
🎯 Scenarios
1. Baseline (Consolidation and rebound): Holding $78,500 will pave the way for a retest of $81,000–$82,000 to "take away" the liquidity of accumulated shorts.
2. Alternative (Deeper Markdown): A loss of $78,500 will send the price to the key trend support of $76,600–$77,000, where the fate of further bullish momentum will be decided.
⚠️ Summary: Trading from the market is not advisable now. The optimal strategy is to wait for confirmation of a reversal on the lower timeframes from the levels of $78,700 or $77,000.
🚀 Analysis of $BTC /USD (4H): where next after the withdrawal of liquidity?
The Bitcoin chart has undergone a predicted local correction after an impulse jump to $82,000+. The current price is trading around $79,860, and the data clearly shows what exactly happened in the market.
🔍 Key factors from charts and metrics
➡️ Liquidation Map: A powerful wave of liquidations of long positions with high leverage took place in the $78,000–$79,000 area. The market unloaded the cabins before the next choice of direction.
➡️ Order glass and volumes: Above the current price ($81,000–$83,000), a dense wall of Sell limits remains, which restrains a quick rebound. At the same time, good buying support has formed in the $76,000–$78,000 area.
➡️ Gamma Zones (GEX+): The lower threshold of the risk corridor is shifted to $75,300–$78,200. As long as the price is above this range, the global pattern remains constructive.
📊 Levels to watch
Resistance: $81,000–$82,500 (short liquidity accumulation and sales zones).
Support 1: $78,500–$78,700 (local bottom after the last drain).
Support 2 (key): $76,600–$77,000 (dynamic trendline).
🎯 Scenarios
1. Baseline (Consolidation and rebound): Holding $78,500 will pave the way for a retest of $81,000–$82,000 to "take away" the liquidity of accumulated shorts.
2. Alternative (Deeper Markdown): A loss of $78,500 will send the price to the key trend support of $76,600–$77,000, where the fate of further bullish momentum will be decided.
⚠️ Summary: Trading from the market is not advisable now. The optimal strategy is to wait for confirmation of a reversal on the lower timeframes from the levels of $78,700 or $77,000.