#BTC
Bitcoin (BTC/USDT) Technical Breakdown: Navigating the 4-Hour Liquidity Sweep & Projection
Executive Summary
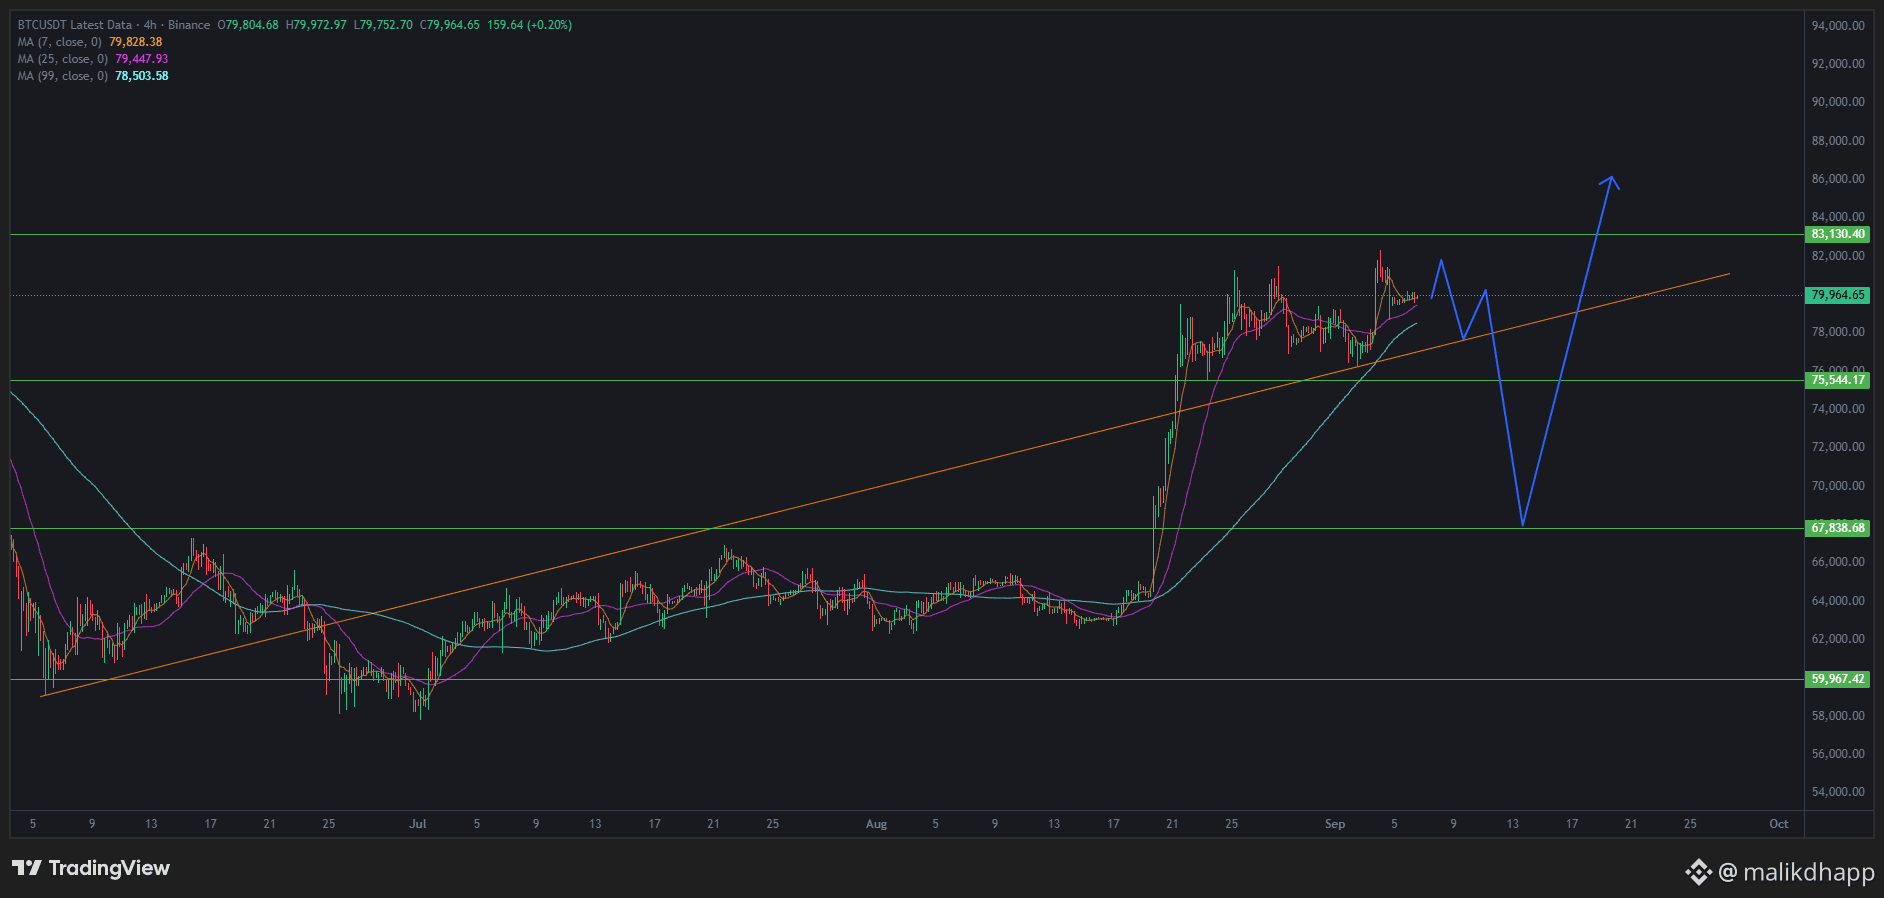
Bitcoin is currently trading near $79,964, consolidating around a major high-timeframe trendline resistance and structural liquidity level. Price action on the 4-hour chart reveals potential for a key liquidity grab—a classic bull trap—before a deeper corrective retracement toward major support levels. Traders should exercise high caution and await clear market confirmation rather than trading impulsively.
Key Technical Levels to Watch
Immediate Resistance Zone: $81,130 - $83,000
Major Overhead Target / Liquidity Pool: $86,000
First Major Support Zone: $75,544
Primary Accumulation / Deep Support Zone: $67,838
Invalidation / Swing Low Support: $59,967
Technical Breakdown & Price Action Analysis
1. The Breakout & Consolidation Phase
Following a strong parabolic rally out of the lower accumulation range ($60,000–$64,000), BTC broke past critical resistance levels and established an ascending trendline support. Currently, price is moving tightly within a rising structure, testing overhead supply near $80,000.
2. Potential Scenario: Fakeout / Liquidity Hunt
The Trapping Mechanism: Price action suggests a potential temporary spike through key resistance toward the $82,000–$83,000 area. This movement often triggers break-out buyers and sweeps buy-side liquidity (stop-losses of short positions).
The Correction Phase: If buying volume fails to sustain above $83,000, a sharp rejection could occur, driving prices back down to test ascending trendline support and leading to a drop toward the primary demand zone around $67,838.
3. The Macro Bullish Outlook (Post-Correction)
A deep retracement toward $67,838 would serve as a healthy market retest, clearing over-leveraged long positions and building structural liquidity. A strong bounce from this demand zone would set up the next major leg higher toward $86,000+.
Bitcoin (BTC/USDT) Technical Breakdown: Navigating the 4-Hour Liquidity Sweep & Projection
Executive Summary
Bitcoin is currently trading near $79,964, consolidating around a major high-timeframe trendline resistance and structural liquidity level. Price action on the 4-hour chart reveals potential for a key liquidity grab—a classic bull trap—before a deeper corrective retracement toward major support levels. Traders should exercise high caution and await clear market confirmation rather than trading impulsively.
Key Technical Levels to Watch
Immediate Resistance Zone: $81,130 - $83,000
Major Overhead Target / Liquidity Pool: $86,000
First Major Support Zone: $75,544
Primary Accumulation / Deep Support Zone: $67,838
Invalidation / Swing Low Support: $59,967
Technical Breakdown & Price Action Analysis
1. The Breakout & Consolidation Phase
Following a strong parabolic rally out of the lower accumulation range ($60,000–$64,000), BTC broke past critical resistance levels and established an ascending trendline support. Currently, price is moving tightly within a rising structure, testing overhead supply near $80,000.
2. Potential Scenario: Fakeout / Liquidity Hunt
The Trapping Mechanism: Price action suggests a potential temporary spike through key resistance toward the $82,000–$83,000 area. This movement often triggers break-out buyers and sweeps buy-side liquidity (stop-losses of short positions).
The Correction Phase: If buying volume fails to sustain above $83,000, a sharp rejection could occur, driving prices back down to test ascending trendline support and leading to a drop toward the primary demand zone around $67,838.
3. The Macro Bullish Outlook (Post-Correction)
A deep retracement toward $67,838 would serve as a healthy market retest, clearing over-leveraged long positions and building structural liquidity. A strong bounce from this demand zone would set up the next major leg higher toward $86,000+.