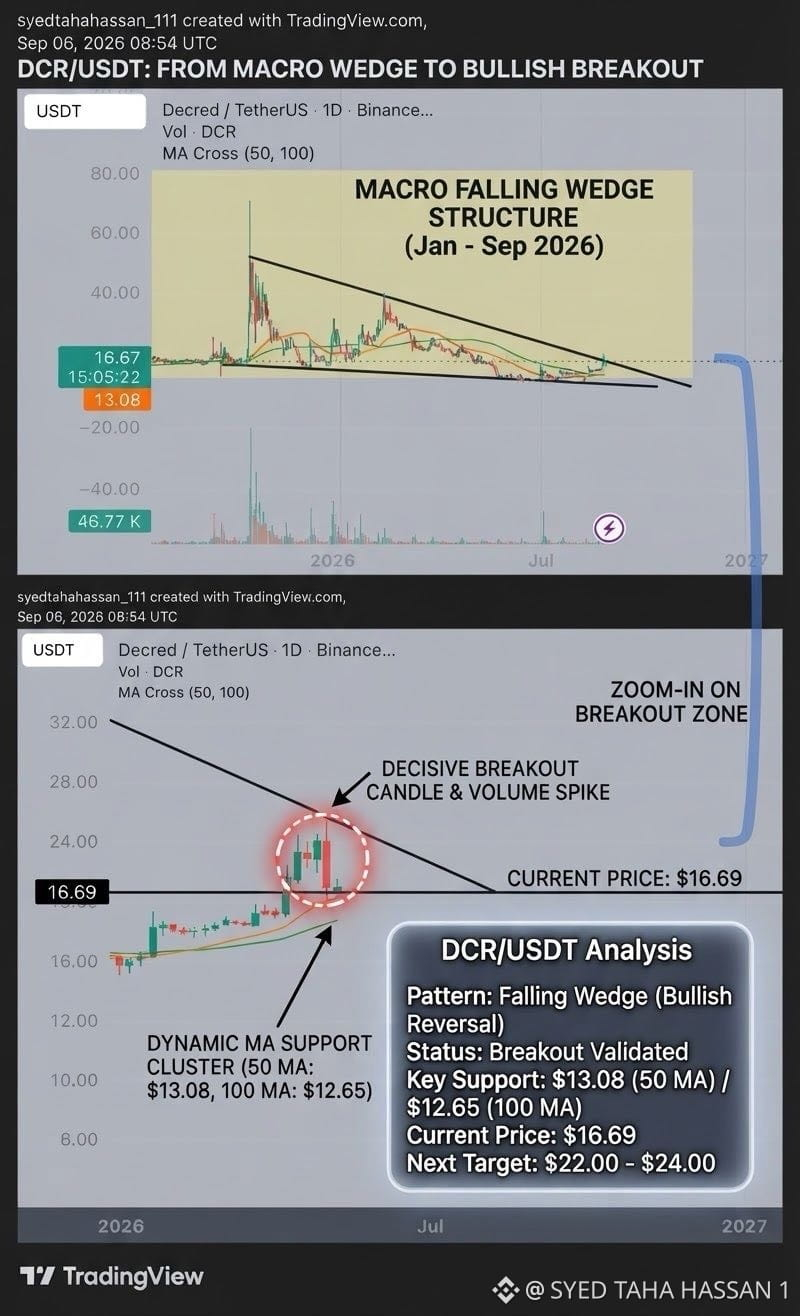
$DCR Falling Wedge Structural Dynamics
The daily DCR/USDT chart highlights a textbook falling wedge formation spanning nearly nine months. Lower highs and lower lows converged tightly into a compression zone, signaling seller exhaustion. The upper resistance trendline, which rejected price multiple times since the early 2026 impulsive peak, has been cleanly breached, shifting the macro market structure from bearish consolidation to a bullish expansion phase.
Moving Average Confluence & Support
The 50-day moving average ($13.08) and 100-day moving average ($12.65) are compressed tightly just below current price action ($16.69). This narrow band serves as a robust dynamic support cluster. Because price has broken out above both indicators while they transition from overhead resistance into a rising slope, the moving averages reinforce the structural shift, providing a high-confluence zone for trend-continuation entries.
Volume Expansion & Momentum Confirmation
The breakout candle is accompanied by a massive, anomalous volume spike relative to the preceding months of low-liquidity drift. This high-conviction participation validates the breakout, significantly reducing the probability of a bull trap. Sustained trading volume above the breakout threshold confirms that buyers are actively absorbing residual supply.
Actionable Levels & Risk Management
* Immediate Resistance / Target 1: The next historical liquidity pocket sits near previous structural reaction highs, with initial upside objectives projected toward the $22.00 to $24.00 range.
* Macro Target: Standard wedge measurement techniques projecting the maximum width of the wedge back to the breakout point point toward higher resistance zones near $32.00.
* Invalidation / Stop Loss: A daily candle close back inside the wedge structure (below the $13.50 support threshold or a break under the 100 MA at $12.65) invalidates the bullish thesis and signals a failed breakout.
The daily DCR/USDT chart highlights a textbook falling wedge formation spanning nearly nine months. Lower highs and lower lows converged tightly into a compression zone, signaling seller exhaustion. The upper resistance trendline, which rejected price multiple times since the early 2026 impulsive peak, has been cleanly breached, shifting the macro market structure from bearish consolidation to a bullish expansion phase.
Moving Average Confluence & Support
The 50-day moving average ($13.08) and 100-day moving average ($12.65) are compressed tightly just below current price action ($16.69). This narrow band serves as a robust dynamic support cluster. Because price has broken out above both indicators while they transition from overhead resistance into a rising slope, the moving averages reinforce the structural shift, providing a high-confluence zone for trend-continuation entries.
Volume Expansion & Momentum Confirmation
The breakout candle is accompanied by a massive, anomalous volume spike relative to the preceding months of low-liquidity drift. This high-conviction participation validates the breakout, significantly reducing the probability of a bull trap. Sustained trading volume above the breakout threshold confirms that buyers are actively absorbing residual supply.
Actionable Levels & Risk Management
* Immediate Resistance / Target 1: The next historical liquidity pocket sits near previous structural reaction highs, with initial upside objectives projected toward the $22.00 to $24.00 range.
* Macro Target: Standard wedge measurement techniques projecting the maximum width of the wedge back to the breakout point point toward higher resistance zones near $32.00.
* Invalidation / Stop Loss: A daily candle close back inside the wedge structure (below the $13.50 support threshold or a break under the 100 MA at $12.65) invalidates the bullish thesis and signals a failed breakout.