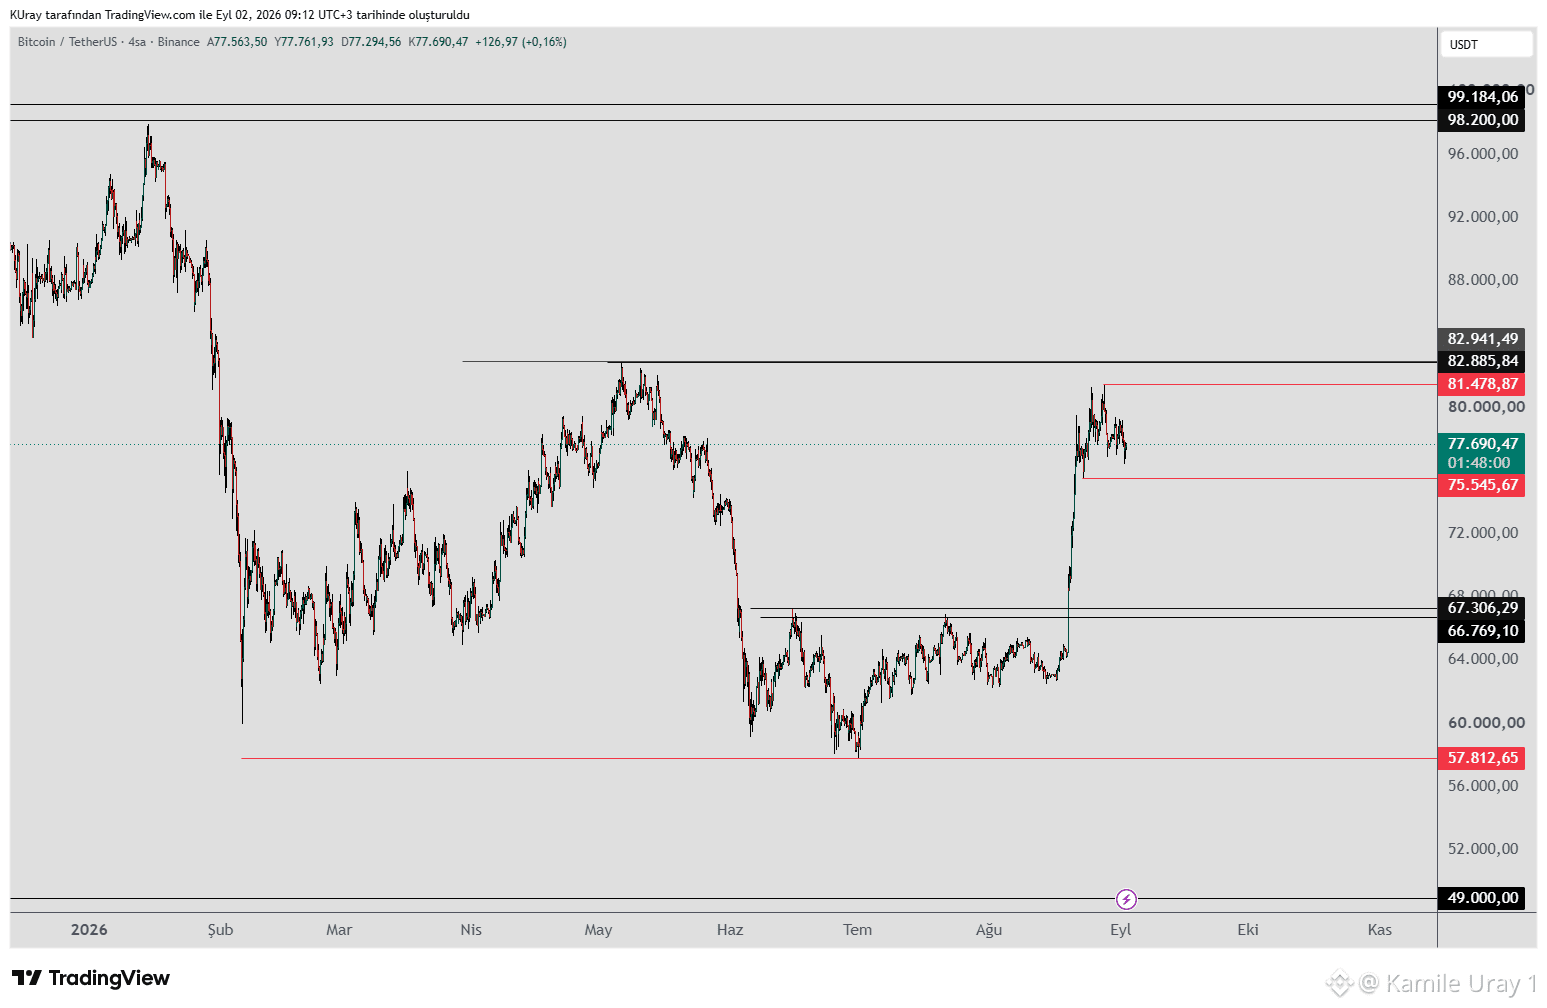
#BTC remains unchanged, trading within the 81,478–75,545 range. The current structure reinforces the likelihood of a continued decline; notably, the rebound following the last downward wave failed to close above the previous peak.
If the price closes below 75,545, it may test the support zone around 67,000–66,000.
These declines could potentially form the final shoulder of an Inverse Head and Shoulders (H&S) pattern.
Although a decline is anticipated, the possibility of a larger bullish Inverse H&S pattern is emerging.
If the price holds above 83,000, the pattern would activate, and a continued rise toward upper resistance levels would be expected.
A daily or weekly close above 82,885 would mark the first higher peak relative to the recent downward wave, serving as a positive signal that the upward trend is likely to continue.
If the price closes below 75,545, it may test the support zone around 67,000–66,000.
These declines could potentially form the final shoulder of an Inverse Head and Shoulders (H&S) pattern.
Although a decline is anticipated, the possibility of a larger bullish Inverse H&S pattern is emerging.
If the price holds above 83,000, the pattern would activate, and a continued rise toward upper resistance levels would be expected.
A daily or weekly close above 82,885 would mark the first higher peak relative to the recent downward wave, serving as a positive signal that the upward trend is likely to continue.