#SKHynixStudiesJapanMemoryChipVenture
$SOL
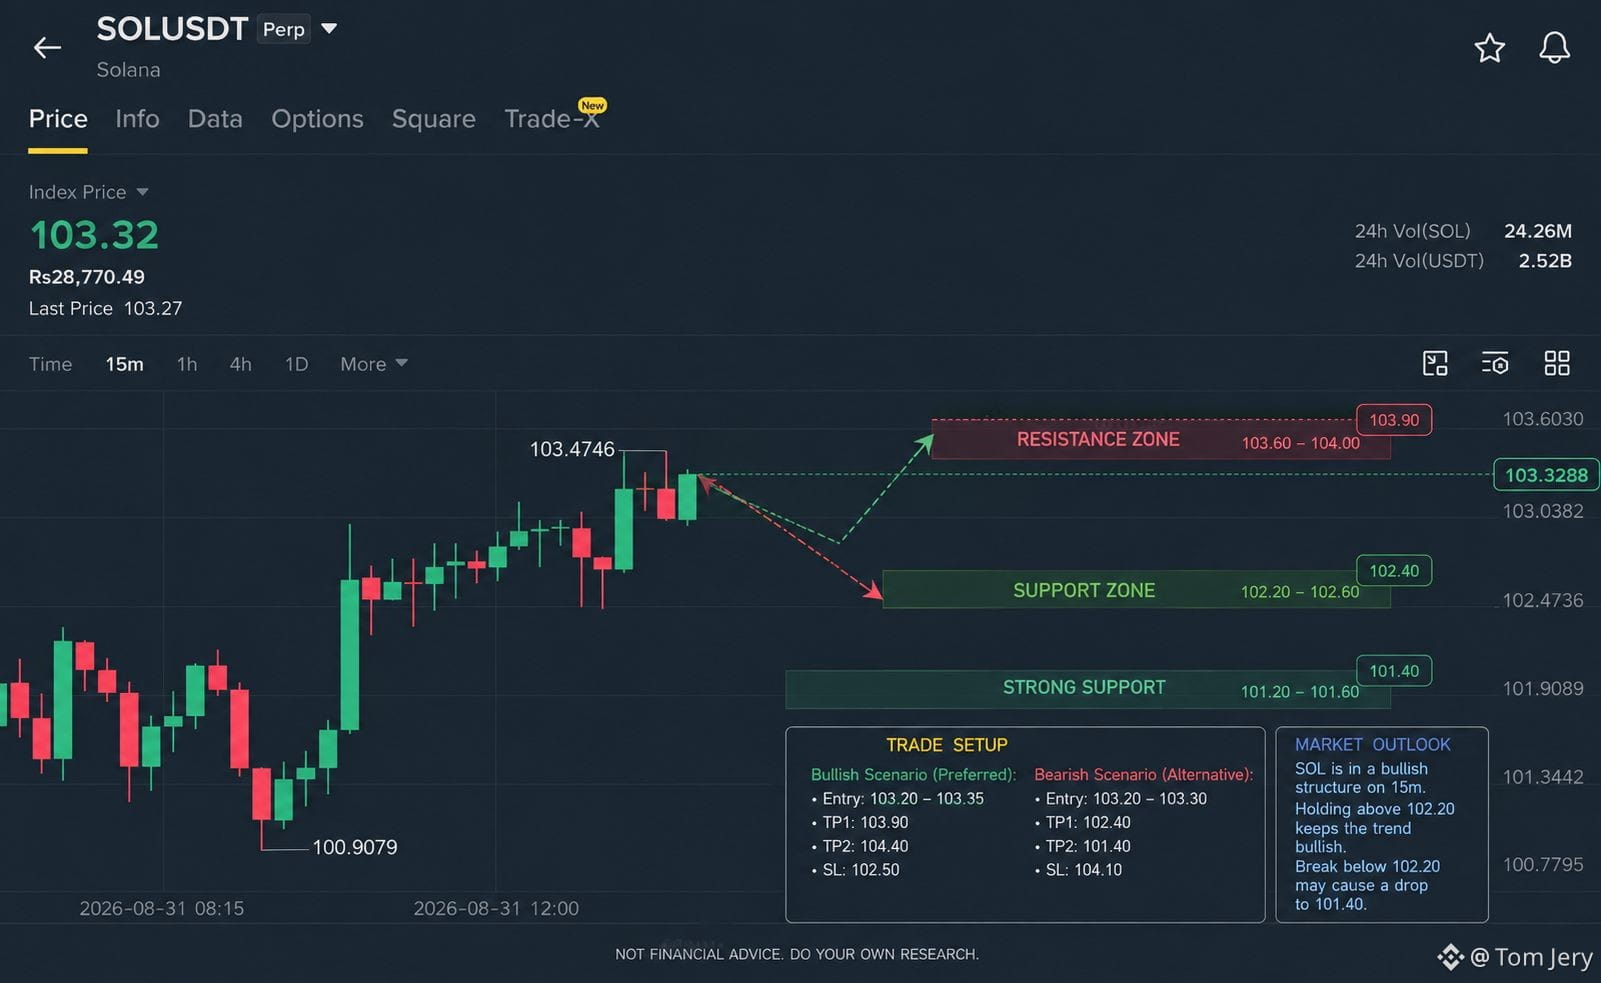
📈 Current structure
Price: ~103.27
Recent swing high: 103.47
Short-term trend: bullish — price has been making higher highs/higher lows from ~100.91.
However, price is now sitting just below a meaningful resistance area.
Key levels
Level Meaning
103.47 Immediate resistance / recent high
103.60–104.00 Major resistance zone
103.00–103.05 Immediate support
102.47 Important support
101.90–101.60 Stronger downside support
🟢 Bullish setup
The cleaner long signal would be a 15m candle close above 103.47, preferably followed by a hold/retest.
Potential path:
103.30 → 103.47 → 103.60 → 104.00+
I would not chase a large green candle directly into 103.60–104.00 resistance. A breakout + retest is safer than entering purely because momentum looks strong.
🔴 Bearish setup
If SOL repeatedly rejects 103.47–103.60 and then loses 103.00, the pullback could target:
102.47 → 102.20
A decisive break below 102.20 would weaken the current bullish structure and could open the way toward the 101.6–101.9 area.
🎯 My bias
Slightly bullish while above ~103.00, but we're approaching resistance, so the best confirmation is:
Above 103.47 = bullish continuation
Below 103.00 = caution / pullback
Below 102.47 = structure turning bearish
If you're trading futures, I'd keep leverage modest and define the invalidation before entering. This is chart analysis, not financial advice.
$SOL
📈 Current structure
Price: ~103.27
Recent swing high: 103.47
Short-term trend: bullish — price has been making higher highs/higher lows from ~100.91.
However, price is now sitting just below a meaningful resistance area.
Key levels
Level Meaning
103.47 Immediate resistance / recent high
103.60–104.00 Major resistance zone
103.00–103.05 Immediate support
102.47 Important support
101.90–101.60 Stronger downside support
🟢 Bullish setup
The cleaner long signal would be a 15m candle close above 103.47, preferably followed by a hold/retest.
Potential path:
103.30 → 103.47 → 103.60 → 104.00+
I would not chase a large green candle directly into 103.60–104.00 resistance. A breakout + retest is safer than entering purely because momentum looks strong.
🔴 Bearish setup
If SOL repeatedly rejects 103.47–103.60 and then loses 103.00, the pullback could target:
102.47 → 102.20
A decisive break below 102.20 would weaken the current bullish structure and could open the way toward the 101.6–101.9 area.
🎯 My bias
Slightly bullish while above ~103.00, but we're approaching resistance, so the best confirmation is:
Above 103.47 = bullish continuation
Below 103.00 = caution / pullback
Below 102.47 = structure turning bearish
If you're trading futures, I'd keep leverage modest and define the invalidation before entering. This is chart analysis, not financial advice.