
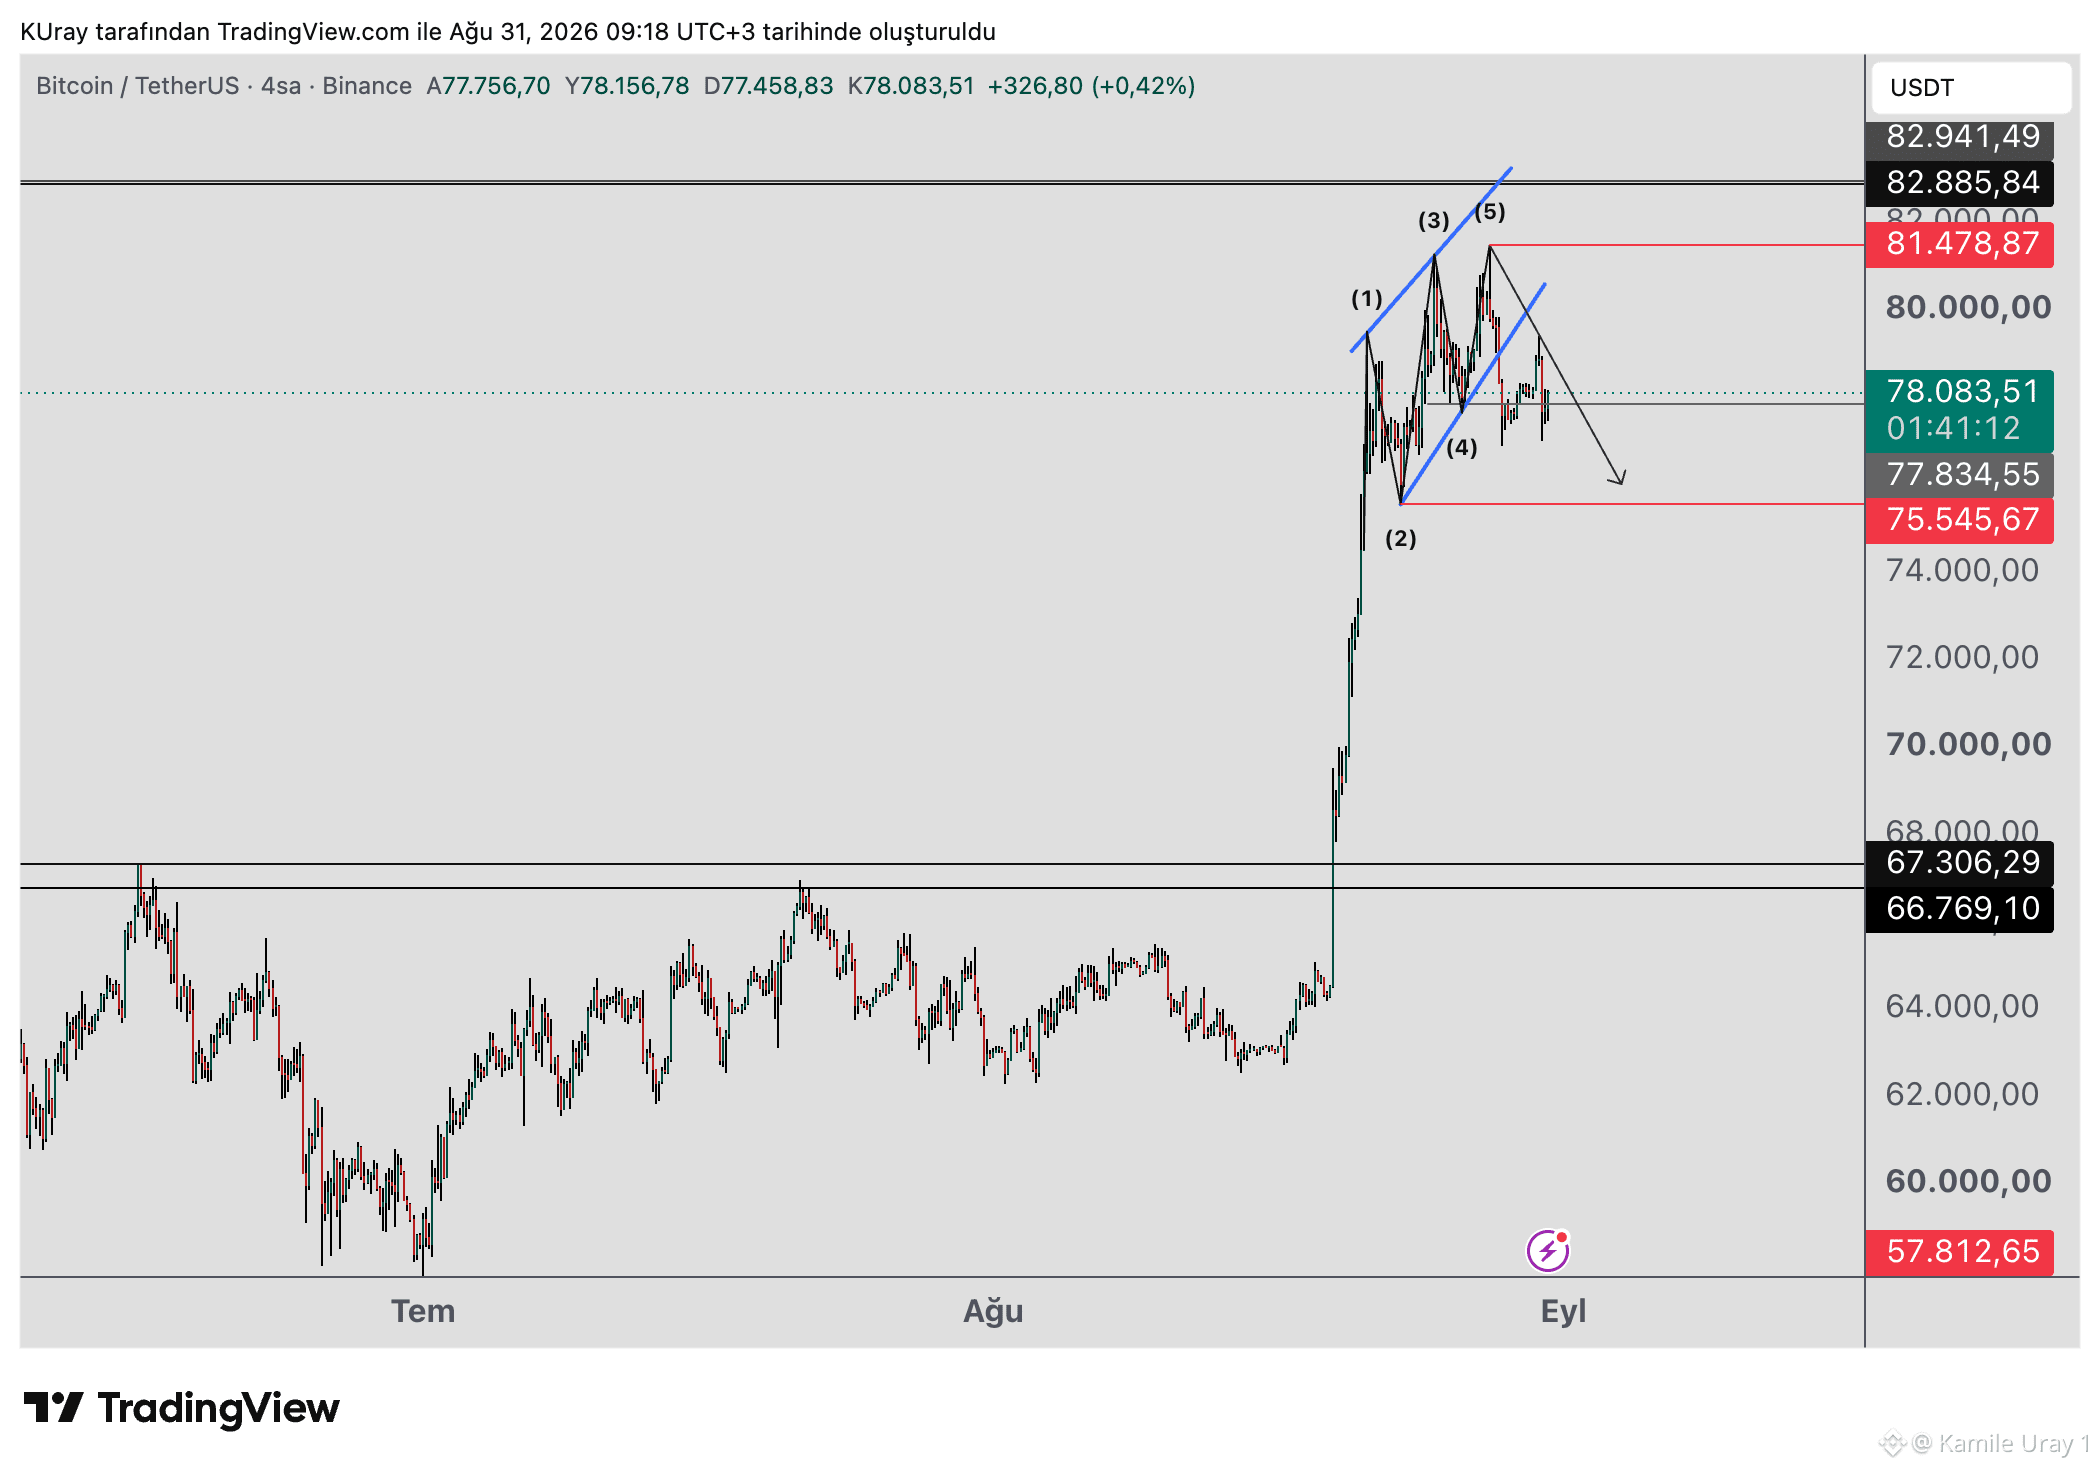
#BTC dropped before it could complete the Wolfe Wave pattern; the wedge structure played out instead. Sell pressure had built up at the peaks marked '3' and '5' within the wedge. Candlesticks with long upper wicks formed at the highs—a key indicator that this structure was likely to trigger a move. Additionally, an RSI divergence during the rise provided a secondary bearish signal, confirming the wedge's validity. We will now monitor the 81,478 peak; failure to close a 4-hour candle above this level implies the decline will continue. The 75,545 level serves as the first support during the drop; if the price holds below this, the decline could extend further, potentially testing the support zone around 67,000–66,000. This decline likely forms the final shoulder of an Inverse Head and Shoulders (IH&S) pattern; if the price holds above 83,000, the pattern activates, and a continued rise toward upper resistance levels would be expected. If the price closes above 82,885 on both daily and weekly timeframes, it would mark the first higher high relative to the recent bearish wave, providing a positive signal that the upward trend is set to continue.

Veröffentlichen
Haftungsausschluss: Enthält Meinungen von Drittanbietern. Keine Beratung. Binance AI wird ohne Gewähr bereitgestellt. Siehe AGB.