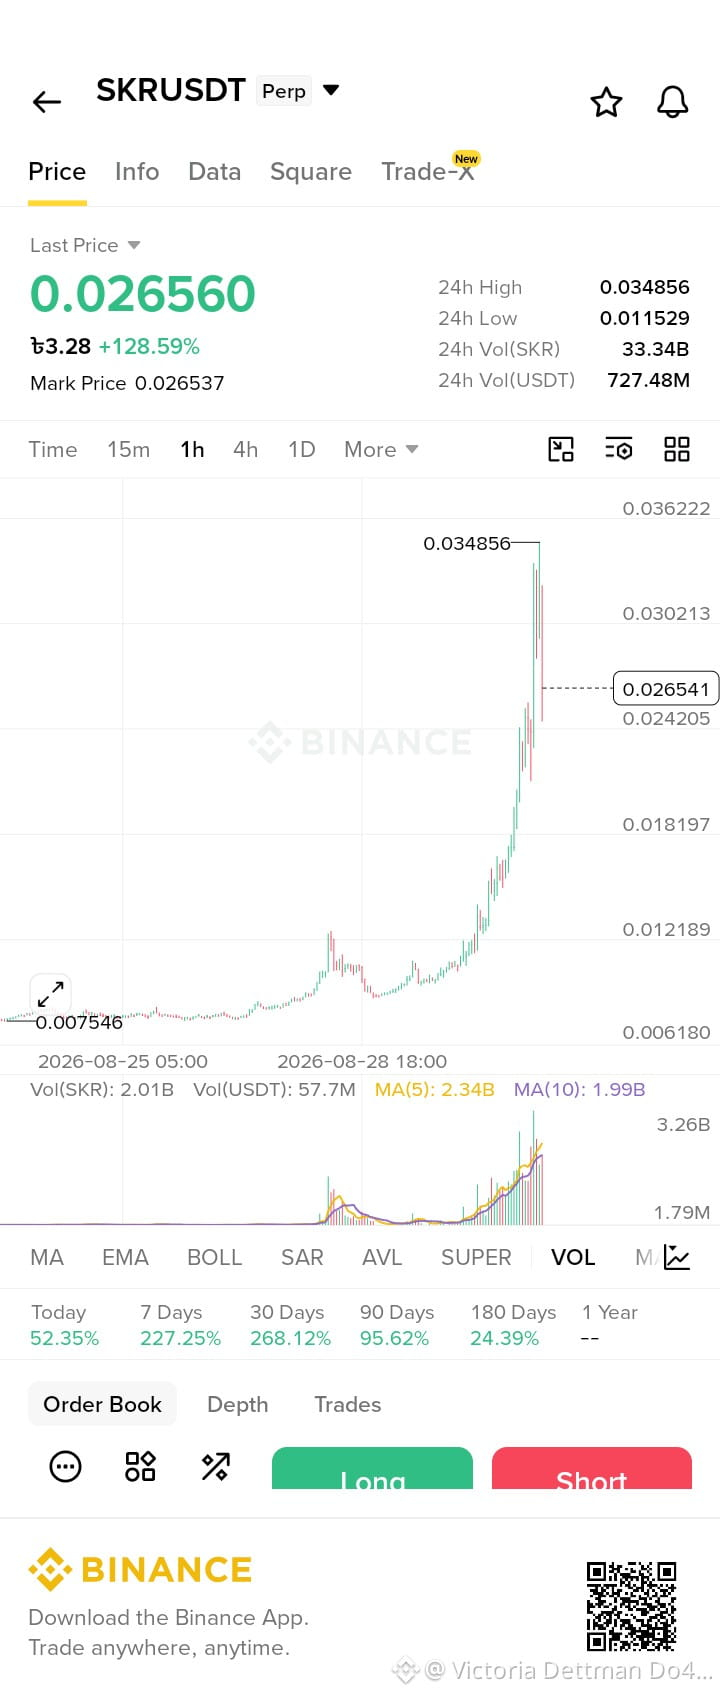
SKRUSDT (1H Chart) Technical Analysis
Current Price: 0.02656 USDT
24H Change: +128.59% 🚀
24H High: 0.034856
24H Low: 0.011529
The chart shows a very strong bullish move, with SKR making a sharp upward breakout.
Trading volume has increased significantly, confirming strong market activity and buying interest.
After reaching 0.034856, the price pulled back toward 0.0265, showing some profit-taking and increased volatility.
0.0242–0.0265 can be watched as a nearby support area.
0.0302 and 0.03485 are important resistance levels.
Overall: The trend is strongly bullish, but because the price has already moved more than 100% in 24 hours, volatility and pullbacks can be very high. A confirmation above resistance or a healthy pullback toward support would be important before considering the next move.
Current Price: 0.02656 USDT
24H Change: +128.59% 🚀
24H High: 0.034856
24H Low: 0.011529
The chart shows a very strong bullish move, with SKR making a sharp upward breakout.
Trading volume has increased significantly, confirming strong market activity and buying interest.
After reaching 0.034856, the price pulled back toward 0.0265, showing some profit-taking and increased volatility.
0.0242–0.0265 can be watched as a nearby support area.
0.0302 and 0.03485 are important resistance levels.
Overall: The trend is strongly bullish, but because the price has already moved more than 100% in 24 hours, volatility and pullbacks can be very high. A confirmation above resistance or a healthy pullback toward support would be important before considering the next move.