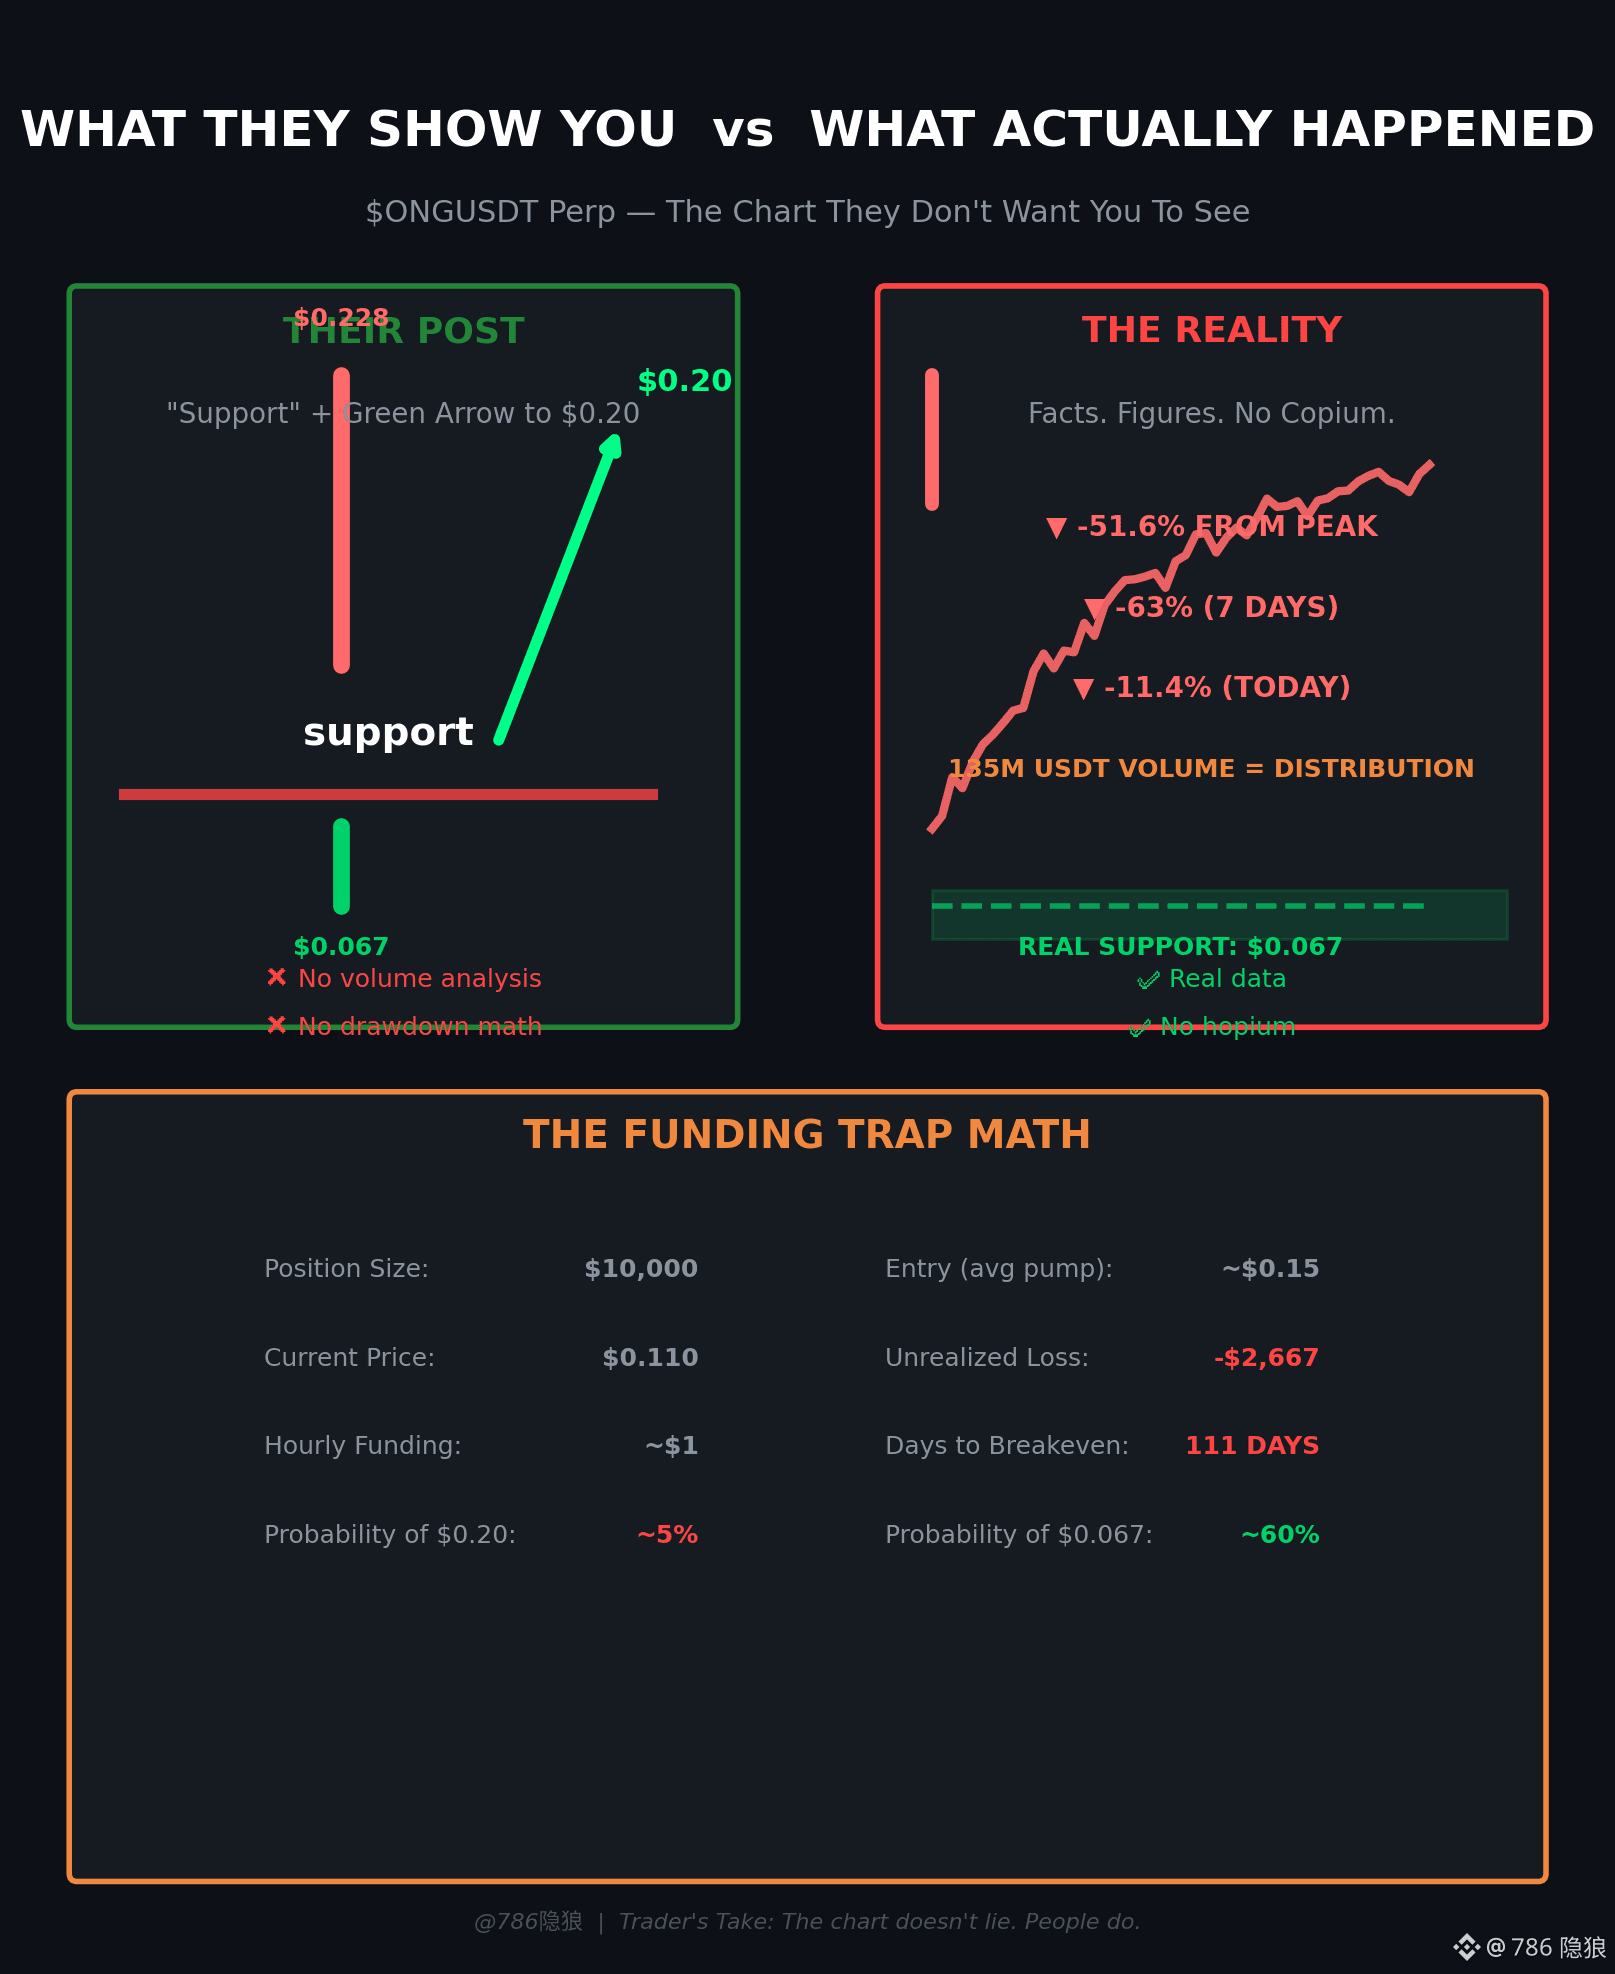

I SAW A POST WITH A GREEN ARROW TO $0.20 ON $ONG .
HERE'S THE MATH THEY DIDN'T SHOW YOU.
126K people saw the "support" line and the rocket.
Here's what wasn't on that chart:
🔻 -51.6% from the peak ($0.228 → $0.110)
🔻 -63% in 7 days
🔻 -11.4% just TODAY
📊 135M USDT volume on the dump = distribution, not accumulation
That "support" at $0.11? It's not support. It's a drawdown in disguise.
The real support is where this pump started: $0.067. There's a 40% gap of air between $0.11 and $0.067. No volume. No consolidation. Just hope.
THE FUNDING TRAP MATH:
If you're long $10K collecting hourly funding:
💰 Hourly income: ~$1
📉 Unrealized loss (if entered mid-pump): -$2,667
⏰ Days of funding to breakeven: 111 DAYS
That's 111 days of praying funding stays positive while $ONG bleeds.
And here's the kicker — funding flips negative when longs get desperate. Then you're paying to hold a bag.
I've fallen for this trap before. We all have.
Green arrows feel good. Math feels bad. But only one of them pays your rent.
SO HERE'S THE QUESTION:
Would you rather collect $1/hour in funding — or lose $2,667 watching a dead cat bounce?
A) Funding king, I'll hold to $0.067 💀
B) Cut the loss, move to a real setup 🎯
$ONG
Follow the signal, not the noise.🐺
HERE'S THE MATH THEY DIDN'T SHOW YOU.
126K people saw the "support" line and the rocket.
Here's what wasn't on that chart:
🔻 -51.6% from the peak ($0.228 → $0.110)
🔻 -63% in 7 days
🔻 -11.4% just TODAY
📊 135M USDT volume on the dump = distribution, not accumulation
That "support" at $0.11? It's not support. It's a drawdown in disguise.
The real support is where this pump started: $0.067. There's a 40% gap of air between $0.11 and $0.067. No volume. No consolidation. Just hope.
THE FUNDING TRAP MATH:
If you're long $10K collecting hourly funding:
💰 Hourly income: ~$1
📉 Unrealized loss (if entered mid-pump): -$2,667
⏰ Days of funding to breakeven: 111 DAYS
That's 111 days of praying funding stays positive while $ONG bleeds.
And here's the kicker — funding flips negative when longs get desperate. Then you're paying to hold a bag.
I've fallen for this trap before. We all have.
Green arrows feel good. Math feels bad. But only one of them pays your rent.
SO HERE'S THE QUESTION:
Would you rather collect $1/hour in funding — or lose $2,667 watching a dead cat bounce?
A) Funding king, I'll hold to $0.067 💀
B) Cut the loss, move to a real setup 🎯
$ONG
Follow the signal, not the noise.🐺