🎯 $BTR /USDT: Analysis and Trading Plan
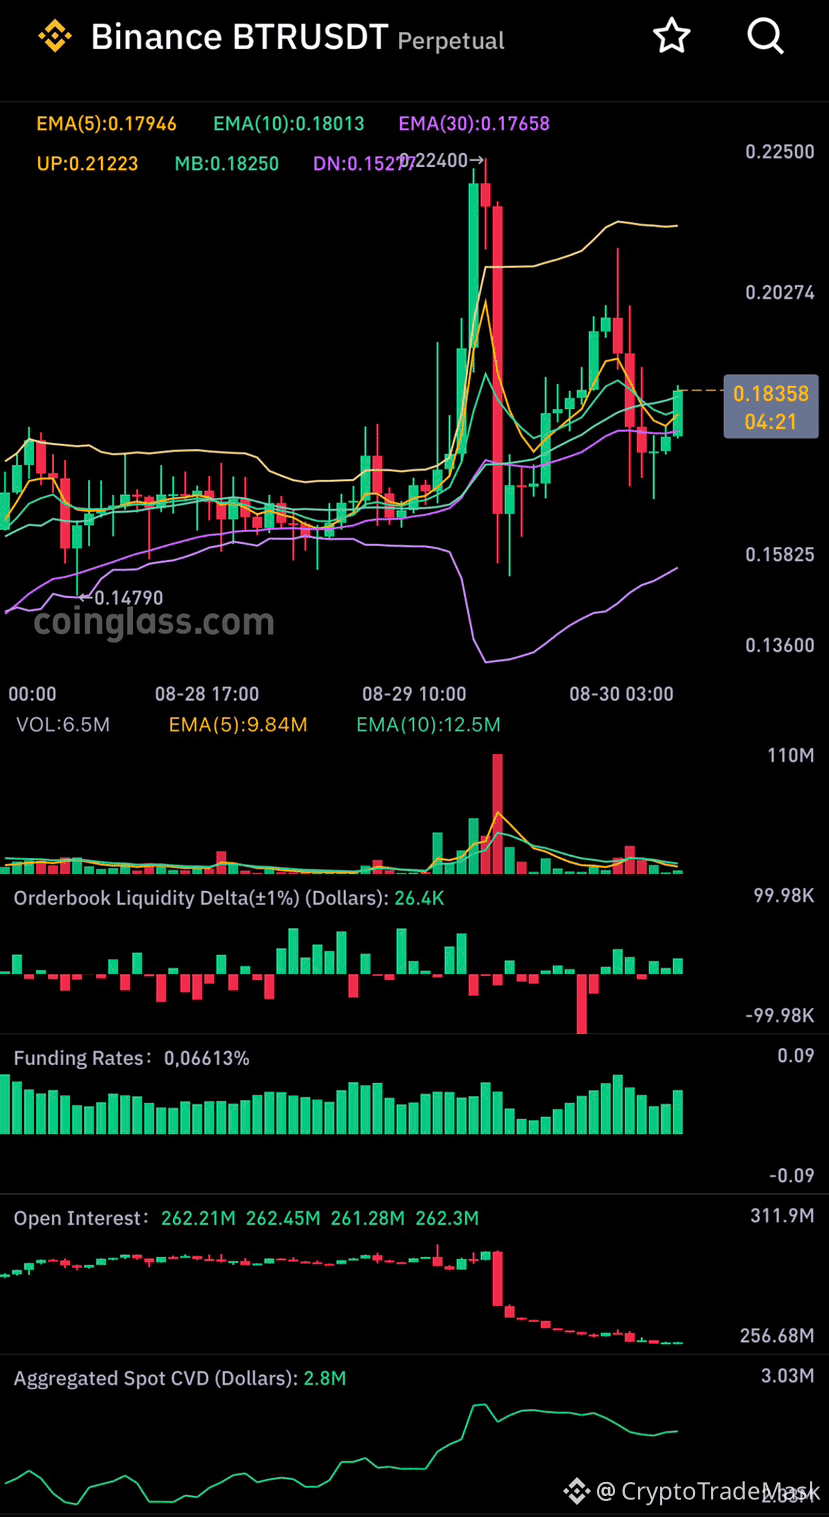
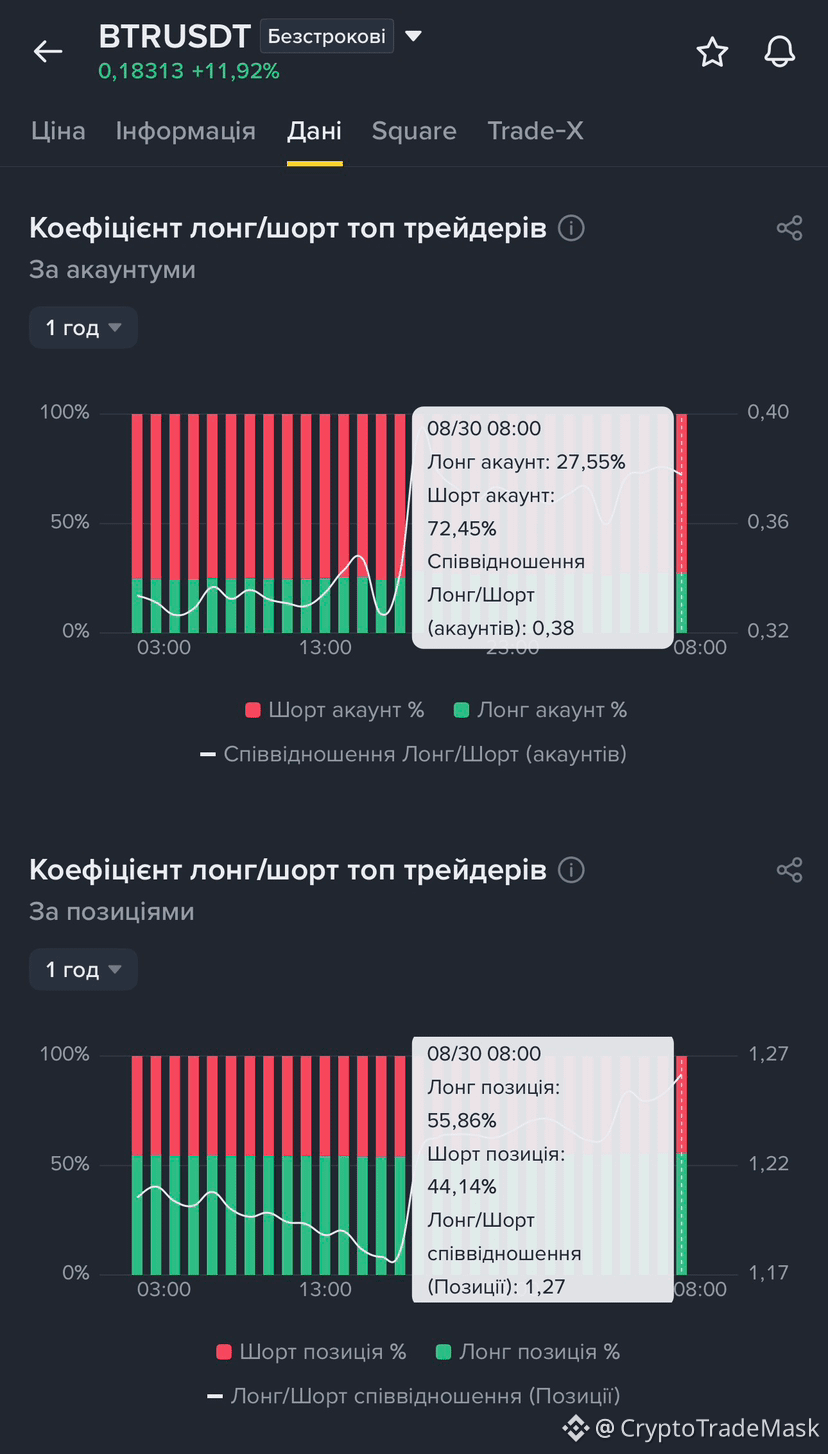
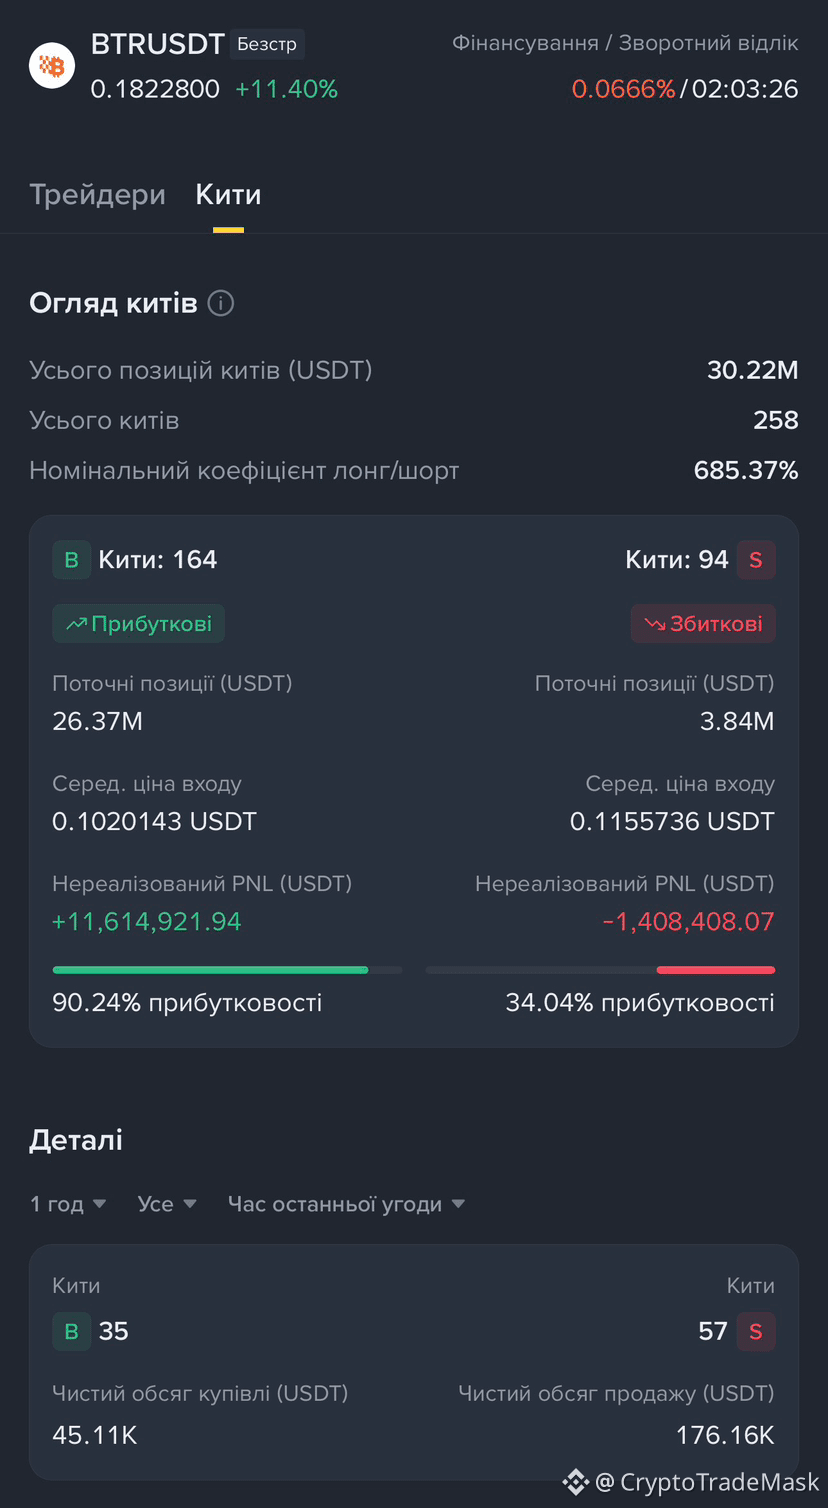
The $BTR USDT chart shows consolidation after an impulse dump to $0.1835. Top traders and whales are mostly long (whale ratio 685%), but most retail accounts (72%) are short.
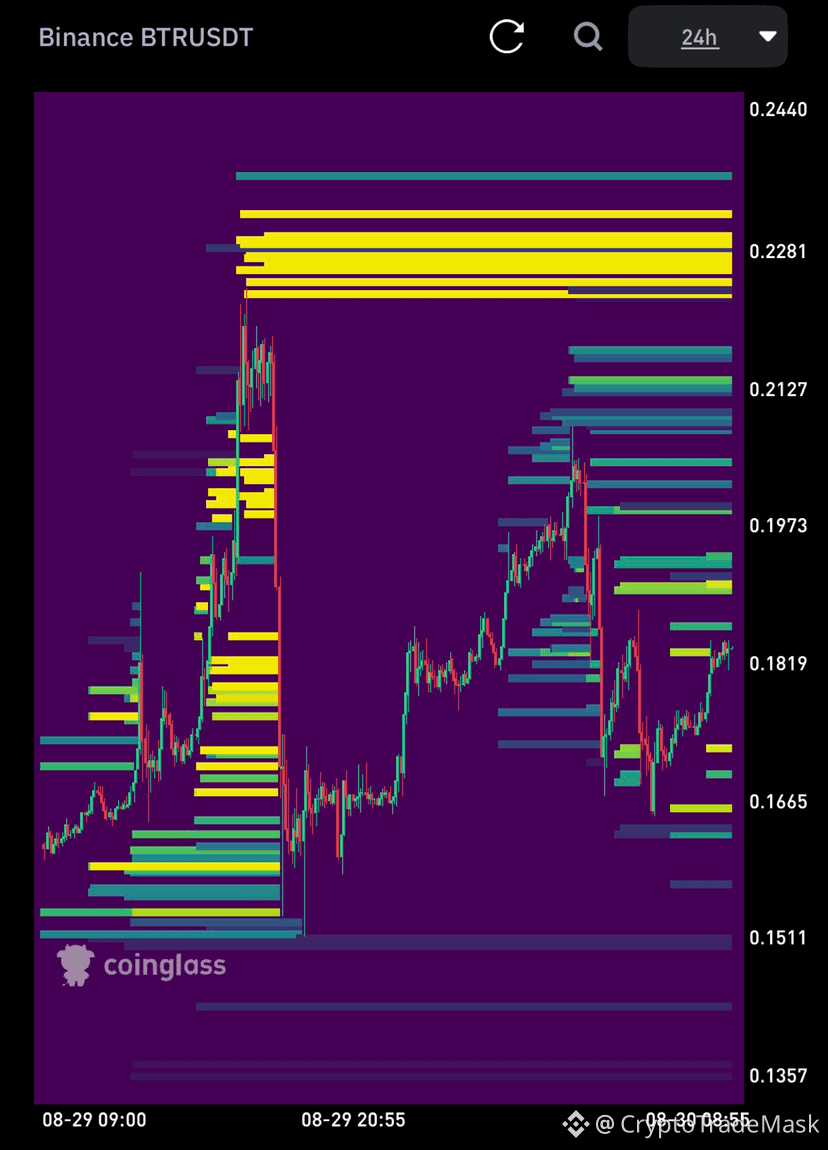
The main liquidity pool for removing stops is in the range of 0.2200 - 0.2350 from above, and the support zone from below is at 0.1660 - 0.1680.
🟢 LONG (Buy)
Entry from support after removing local long stops.
Entry: 0.1680 – 0.1720 USDT
Take-Profit: 0.1970 / 0.2120 / 0.2280 USDT
Stop-Loss: 0.1595 USDT
🔴 SHORT (Sell)
Sell from the zone of dense liquidity Heatmap when approaching resistance.
Entry: 0.2120 – 0.2240 USDT
Take-Profit: 0.1900 / 0.1760 / 0.1650 USDT
Stop-Loss: 0.2360 USDT
⚠️ Volatility is high. Follow risk management: leverage up to 3x–5x, risk per trade no more than 1-2%.
The $BTR USDT chart shows consolidation after an impulse dump to $0.1835. Top traders and whales are mostly long (whale ratio 685%), but most retail accounts (72%) are short.
The main liquidity pool for removing stops is in the range of 0.2200 - 0.2350 from above, and the support zone from below is at 0.1660 - 0.1680.
🟢 LONG (Buy)
Entry from support after removing local long stops.
Entry: 0.1680 – 0.1720 USDT
Take-Profit: 0.1970 / 0.2120 / 0.2280 USDT
Stop-Loss: 0.1595 USDT
🔴 SHORT (Sell)
Sell from the zone of dense liquidity Heatmap when approaching resistance.
Entry: 0.2120 – 0.2240 USDT
Take-Profit: 0.1900 / 0.1760 / 0.1650 USDT
Stop-Loss: 0.2360 USDT
⚠️ Volatility is high. Follow risk management: leverage up to 3x–5x, risk per trade no more than 1-2%.