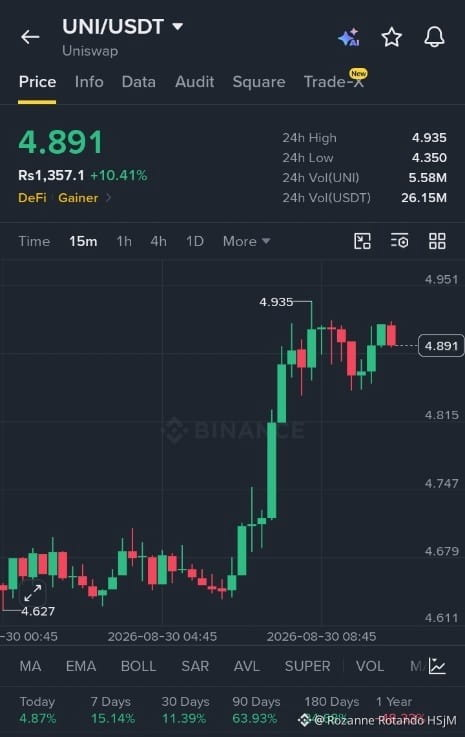
Based on the $UNI
/USDT chart from August 30, 2026:
· Current Price: 4.891 USDT (~Rs1,357.1)
· 24h Change: +10.41% (strong gainer)
· 24h Range: 4.350 – 4.935
· Volume: 5.58M UNI / 26.15M USDT
· Chart Pattern: Price broke above the 4.747–4.815 resistance, currently testing 4.927 (recent high). Trading above all major short-term moving averages (MA, EMA).
· Performance:
· Today: +4.87%
· 7 Days: +15.14%
· 90 Days: +63.93%
· 1 Year: -48.33% (still recovering from longer-term downtrend)
Short-term bias: Bullish above 4.815; next resistance at 4.935–4.951. Support at 4.747 (previous breakout level). A break above 4.935 could target 5.00+.
Would you like entry/exit levels or a risk-adjusted trade setup?
/USDT chart from August 30, 2026:
· Current Price: 4.891 USDT (~Rs1,357.1)
· 24h Change: +10.41% (strong gainer)
· 24h Range: 4.350 – 4.935
· Volume: 5.58M UNI / 26.15M USDT
· Chart Pattern: Price broke above the 4.747–4.815 resistance, currently testing 4.927 (recent high). Trading above all major short-term moving averages (MA, EMA).
· Performance:
· Today: +4.87%
· 7 Days: +15.14%
· 90 Days: +63.93%
· 1 Year: -48.33% (still recovering from longer-term downtrend)
Short-term bias: Bullish above 4.815; next resistance at 4.935–4.951. Support at 4.747 (previous breakout level). A break above 4.935 could target 5.00+.
Would you like entry/exit levels or a risk-adjusted trade setup?