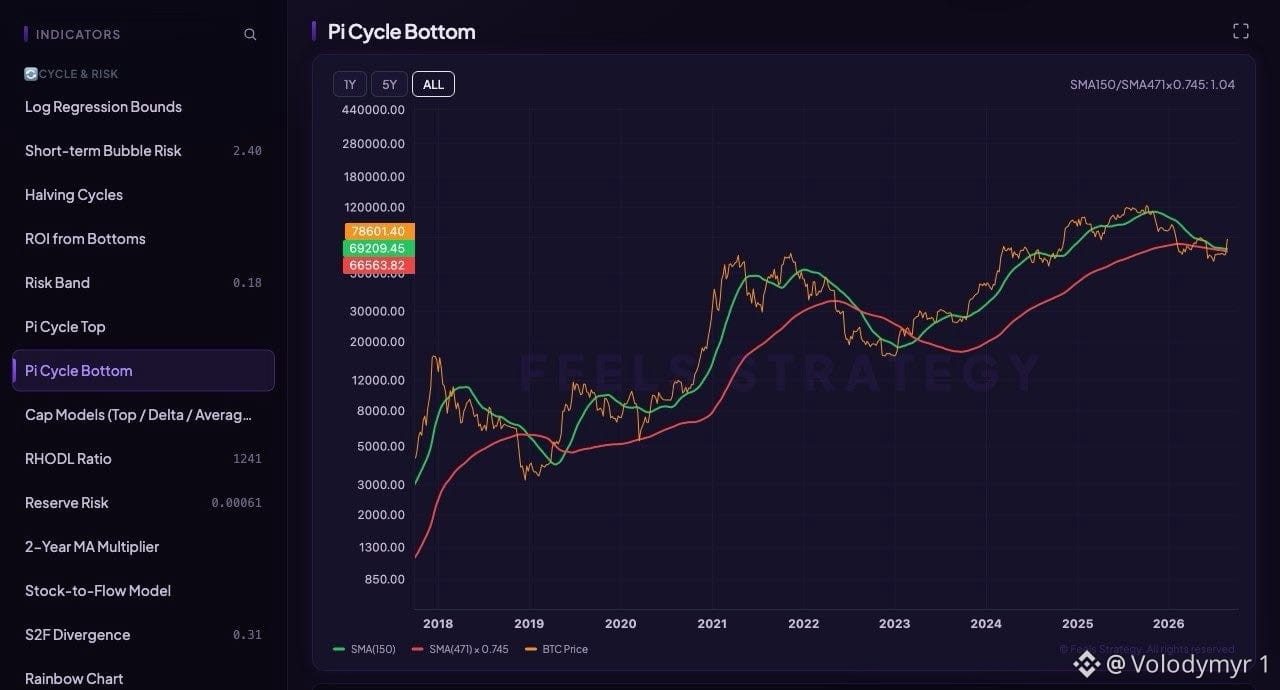
#Bitcoin Pi Cycle Bottom 📉
📝 The Pi Cycle Bottom indicator uses the SMA(150) and SMA(471) multiplied by 0.745 to track historical cycle floors. Currently, the green line sits above the red line, showing no crossover signal yet.
📍 Price is trading near 80K, well away from the levels where these averages converge. While previous bottoms relied on this cross, the current market structure reflects a steady institutional markup phase.
💡 Do not expect a signal here until the broader trend shifts significantly lower. The market remains in consolidation, prioritizing resilience over historical bottom-seeking patterns. $BTC
📝 The Pi Cycle Bottom indicator uses the SMA(150) and SMA(471) multiplied by 0.745 to track historical cycle floors. Currently, the green line sits above the red line, showing no crossover signal yet.
📍 Price is trading near 80K, well away from the levels where these averages converge. While previous bottoms relied on this cross, the current market structure reflects a steady institutional markup phase.
💡 Do not expect a signal here until the broader trend shifts significantly lower. The market remains in consolidation, prioritizing resilience over historical bottom-seeking patterns. $BTC