$MOVR Explosive Pump & Rapid Rejection: Distribution or High-Timeframe Breakout Setup?
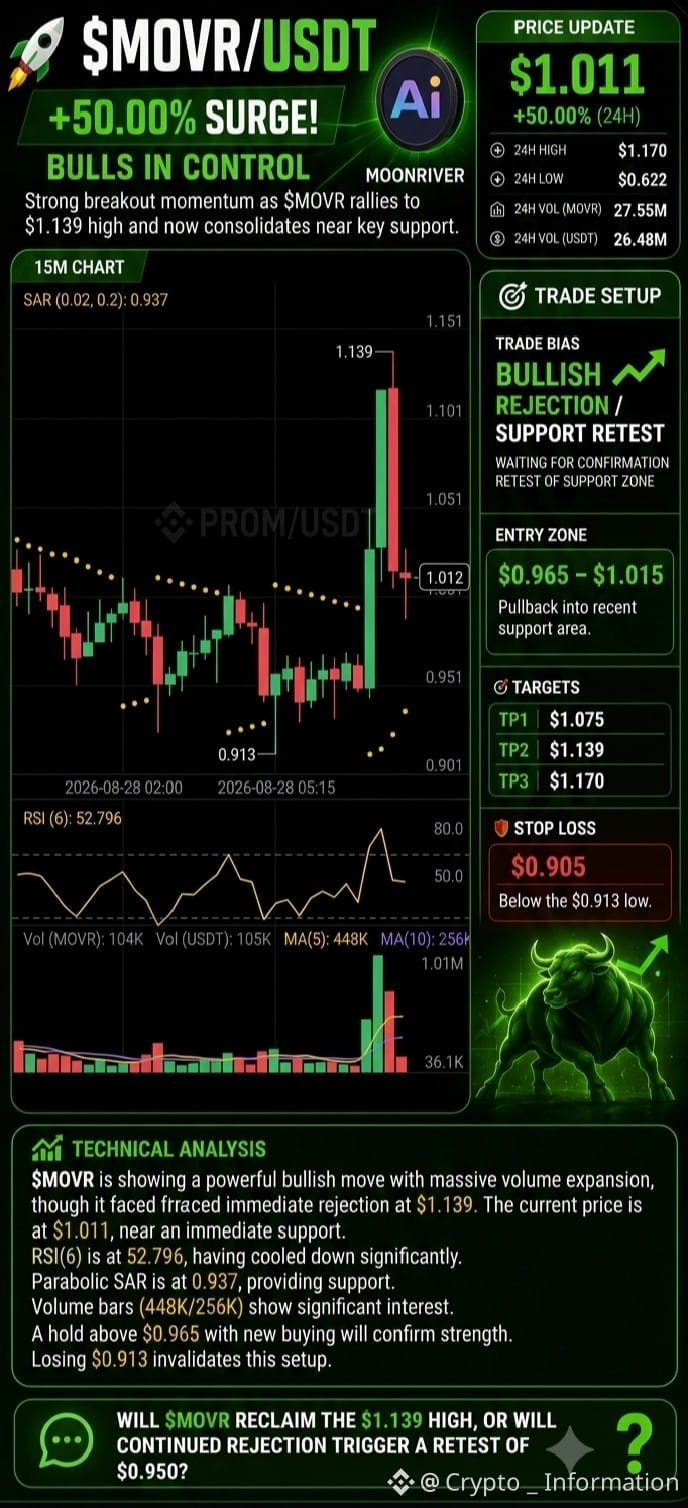
Moonriver ($MOVR ) witnessed a massive volatility expansion on the 15-minute timeframe, pumping over +50.00% within 24 hours to hit a local peak of $1.139 before experiencing a swift rejection back to $1.011. Trading volume exploded alongside the expansion, reaching 27.55M MOVR ($26.48M USDT), while moving averages reflect heavy volume spikes (MA(5) at 448K vs MA(10) at 256K). However, the immediate long-upper-wick candle highlights strong profit-taking at the upper liquidity range ($1.139–$1.170), forcing price action back down near key support zones.
Trade Bias: Bearish Rejection / Retest Setup
Entry Zone: $0.965 – $1.015 (Waiting for confirmation around support retest before taking positions)
Targets: $1.075 ➡️ $1.139 ➡️ $1.170
Stop Loss: $0.905
The technical setup indicates a temporary cooldown following an overextended vertical rally. The 6-period RSI cooled down from overbought territory (above 80.0) to 52.79, signaling neutral momentum as buyers and sellers battle around the $1.010 node. Parabolic SAR (0.937) sits below the current price, maintaining an underlying bullish structure on lower timeframes, but the immediate rejection candle warns of distribution risk. If buyers manage to defend the $0.950–$0.965 support demand zone, a secondary push toward $1.075 and $1.139 remains likely; conversely, losing $0.913 support invalidates the bullish recovery scenario.
Will $MOVR reclaim $1.139 for a continuous bullish rally, or will profit-taking pull the price back below $0.950?
Trade Now $MOVR
#movr #BinanceSquare #TechnicalAnalysis #CryptoSignals
Moonriver ($MOVR ) witnessed a massive volatility expansion on the 15-minute timeframe, pumping over +50.00% within 24 hours to hit a local peak of $1.139 before experiencing a swift rejection back to $1.011. Trading volume exploded alongside the expansion, reaching 27.55M MOVR ($26.48M USDT), while moving averages reflect heavy volume spikes (MA(5) at 448K vs MA(10) at 256K). However, the immediate long-upper-wick candle highlights strong profit-taking at the upper liquidity range ($1.139–$1.170), forcing price action back down near key support zones.
Trade Bias: Bearish Rejection / Retest Setup
Entry Zone: $0.965 – $1.015 (Waiting for confirmation around support retest before taking positions)
Targets: $1.075 ➡️ $1.139 ➡️ $1.170
Stop Loss: $0.905
The technical setup indicates a temporary cooldown following an overextended vertical rally. The 6-period RSI cooled down from overbought territory (above 80.0) to 52.79, signaling neutral momentum as buyers and sellers battle around the $1.010 node. Parabolic SAR (0.937) sits below the current price, maintaining an underlying bullish structure on lower timeframes, but the immediate rejection candle warns of distribution risk. If buyers manage to defend the $0.950–$0.965 support demand zone, a secondary push toward $1.075 and $1.139 remains likely; conversely, losing $0.913 support invalidates the bullish recovery scenario.
Will $MOVR reclaim $1.139 for a continuous bullish rally, or will profit-taking pull the price back below $0.950?
Trade Now $MOVR
#movr #BinanceSquare #TechnicalAnalysis #CryptoSignals