#BestBuyQ2RevenueTopsEstimatesLiftsOutlook EARNINGS PREVIEW - THE LINE THAT MATTERS AT BEST BUY $BBY IS NOT THIS QUARTER:
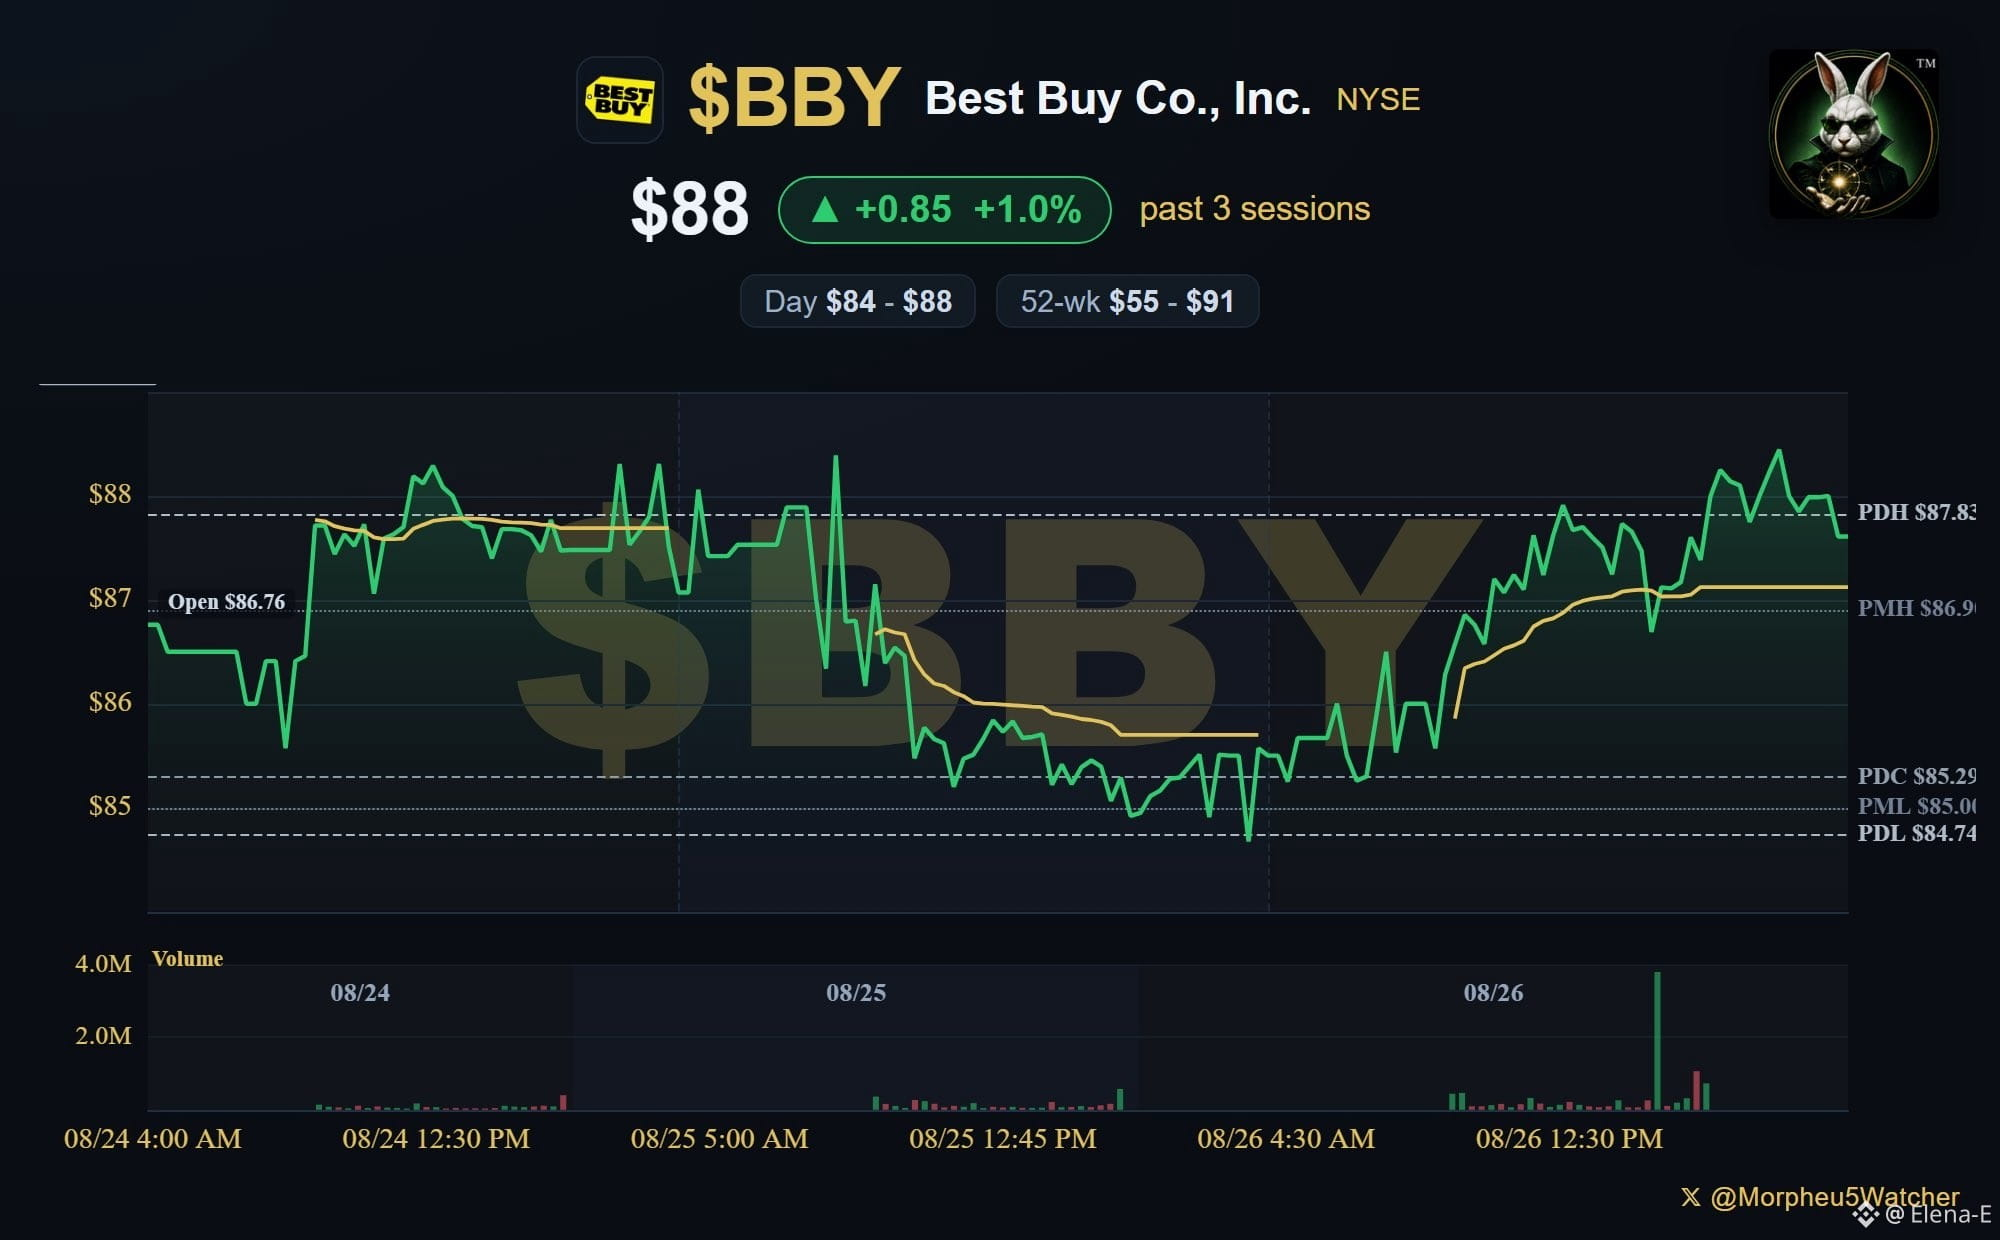
Best Buy $BBY at $88.00 (after hours), +$2.71 / +3.18% from Tuesday's $85.29 close. The Richfield, Minnesota electronics retailer - laptops, phones, TVs, appliances, and Geek Squad repair, across U.S. stores and a Canadian business - reports second-quarter results before Thursday's open, August 27. The number worth waiting for is not the quarter. It is the year.
Here is the tension. Best Buy's own full-year map still says comparable sales - sales at stores and websites open at least a year, the cleanest read on whether shoppers are actually spending more - land somewhere between -1.0% and +1.0%. The first quarter, reported May 28, printed +2.0%: revenue $8.94B, +1.9% from a year earlier; adjusted diluted EPS - profit per share with some one-time items stripped out - $1.28, +11%. Management held the year anyway: revenue $41.2B-$42.1B, adjusted operating income rate - operating profit as a share of sales, before interest and taxes - 4.3%-4.4%, adjusted EPS $6.30-$6.60. On the May call it mapped this quarter's comparable sales near +1.0%, because June laps a blockbuster gaming month a year ago.
The bar underneath it: the same quarter last year did $9.44B of revenue, +1.6% comparable sales, $1.28 adjusted EPS, and a 3.9% adjusted operating income rate.
Three questions going in. Not predictions.
- The band. Does the comparable-sales figure land near the 1% the company mapped, or nearer the 2% to 3% domestic pace outside models carry - and does that -1.0% to +1.0% full-year band finally move after a +2.0% opening quarter?
- The mix. Gaming, computing, mobile phones and services carried the first quarter while appliances fell. Does the laptop replacement wave keep carrying it, and do appliances stop being a drag?$SKR $FWDI $BBY.US
Best Buy $BBY at $88.00 (after hours), +$2.71 / +3.18% from Tuesday's $85.29 close. The Richfield, Minnesota electronics retailer - laptops, phones, TVs, appliances, and Geek Squad repair, across U.S. stores and a Canadian business - reports second-quarter results before Thursday's open, August 27. The number worth waiting for is not the quarter. It is the year.
Here is the tension. Best Buy's own full-year map still says comparable sales - sales at stores and websites open at least a year, the cleanest read on whether shoppers are actually spending more - land somewhere between -1.0% and +1.0%. The first quarter, reported May 28, printed +2.0%: revenue $8.94B, +1.9% from a year earlier; adjusted diluted EPS - profit per share with some one-time items stripped out - $1.28, +11%. Management held the year anyway: revenue $41.2B-$42.1B, adjusted operating income rate - operating profit as a share of sales, before interest and taxes - 4.3%-4.4%, adjusted EPS $6.30-$6.60. On the May call it mapped this quarter's comparable sales near +1.0%, because June laps a blockbuster gaming month a year ago.
The bar underneath it: the same quarter last year did $9.44B of revenue, +1.6% comparable sales, $1.28 adjusted EPS, and a 3.9% adjusted operating income rate.
Three questions going in. Not predictions.
- The band. Does the comparable-sales figure land near the 1% the company mapped, or nearer the 2% to 3% domestic pace outside models carry - and does that -1.0% to +1.0% full-year band finally move after a +2.0% opening quarter?
- The mix. Gaming, computing, mobile phones and services carried the first quarter while appliances fell. Does the laptop replacement wave keep carrying it, and do appliances stop being a drag?$SKR $FWDI $BBY.US