ETF flows just told a different story than the bears have been telling.
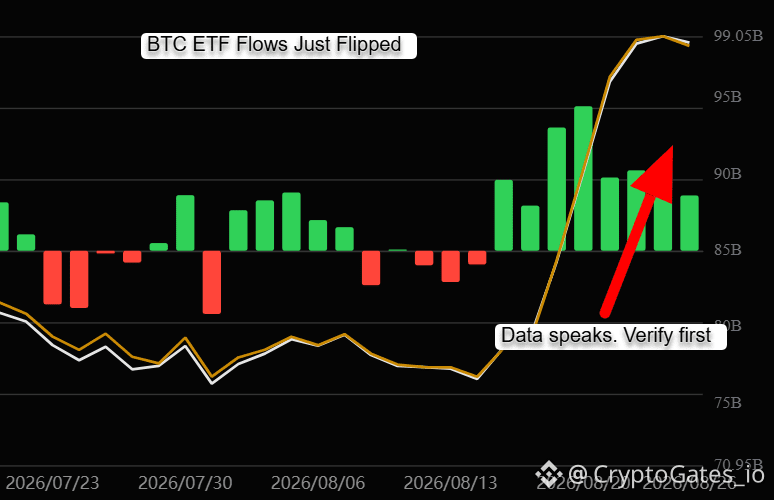
August 26: US spot $BTC ETFs pulled in $232M net inflow. ETH ETFs added $192M the same day. BTC is sitting near $79k after briefly touching above $81k.
Look at the flow chart over the last three months. June and July were mostly red. Mid August onward has been a wall of green, and it's accelerating, not fading.
Here's the part that matters for anyone actually trading this: a large part of the bearish narrative in crypto circles has centered on a breakdown below 60k with a bottom projected somewhere in the 40k to 50k zone. That has not happened. The data is moving opposite to that thesis right now.
Doesn't mean the bulls are automatically right either. Sentiment moving from fear to greed within a month is a caution flag on its own, not a green light to add leverage.
Backtest your thesis against real flow and price data before you position on it. That's the whole point of verifying first.
#BTC #ETFInflows
August 26: US spot $BTC ETFs pulled in $232M net inflow. ETH ETFs added $192M the same day. BTC is sitting near $79k after briefly touching above $81k.
Look at the flow chart over the last three months. June and July were mostly red. Mid August onward has been a wall of green, and it's accelerating, not fading.
Here's the part that matters for anyone actually trading this: a large part of the bearish narrative in crypto circles has centered on a breakdown below 60k with a bottom projected somewhere in the 40k to 50k zone. That has not happened. The data is moving opposite to that thesis right now.
Doesn't mean the bulls are automatically right either. Sentiment moving from fear to greed within a month is a caution flag on its own, not a green light to add leverage.
Backtest your thesis against real flow and price data before you position on it. That's the whole point of verifying first.
#BTC #ETFInflows