
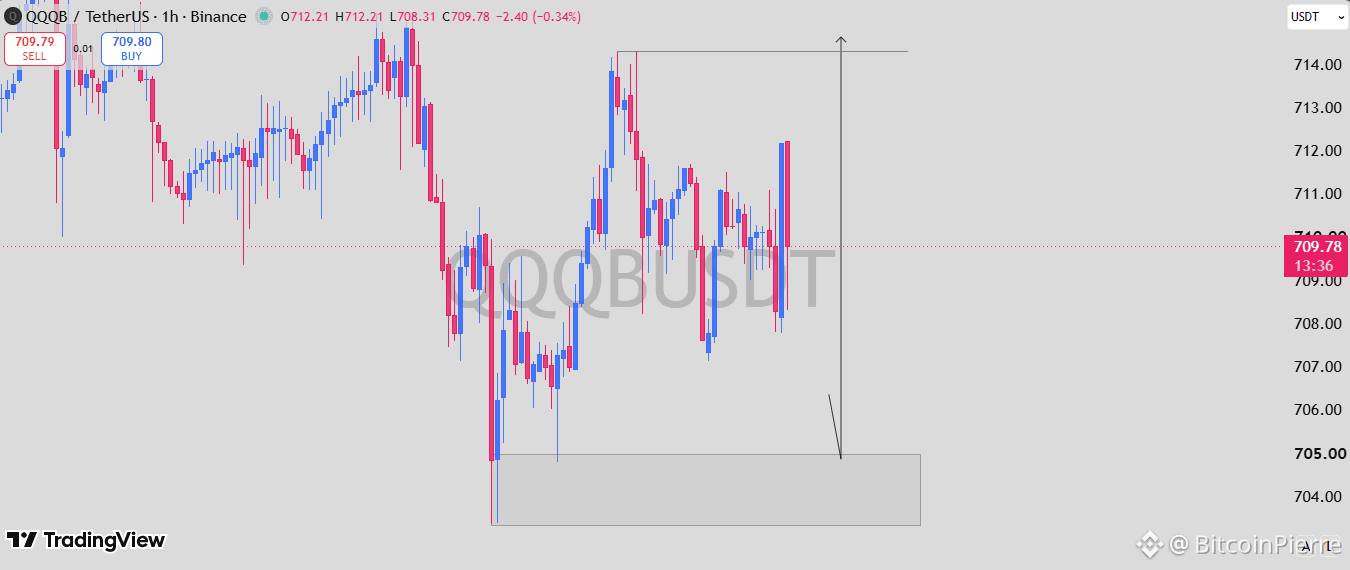
$QQQB /USDT is currently trading around $709.78 on the 1H chart, and the structure is showing signs that another bearish move could be developing. Price has been moving sideways after recovering from the $705 area, but the repeated inability to establish a sustained move above the $711–$712 region suggests that buyers are struggling to maintain control. More importantly, the chart shows a clear resistance zone near $714–$714.5, where price was previously rejected sharply. The current recovery therefore looks vulnerable if QQB continues failing to reclaim higher levels. The projected setup points toward another decline into the $705 area, which is marked as the key demand zone on the chart. A break below the immediate $708–$709 support region would strengthen the bearish scenario and could open the way for a retest of $705. If that zone fails to hold, QQB could potentially extend lower. For now, the important level is $714. A decisive breakout and sustained acceptance above that resistance would invalidate the immediate bearish projection. Until that happens, the chart continues to favor caution, with the $705 demand zone remaining the primary downside objective. #BTC Price Analysis# #Macro Insights# #QQQB

Veröffentlichen
Haftungsausschluss: Enthält Meinungen von Drittanbietern. Keine Beratung. Binance AI wird ohne Gewähr bereitgestellt. Siehe AGB.